
- NZD/USD recovers modestly from its one-week low amid some selling around the USD.
- The technical situation warrants some caution before positioning for significant gains.
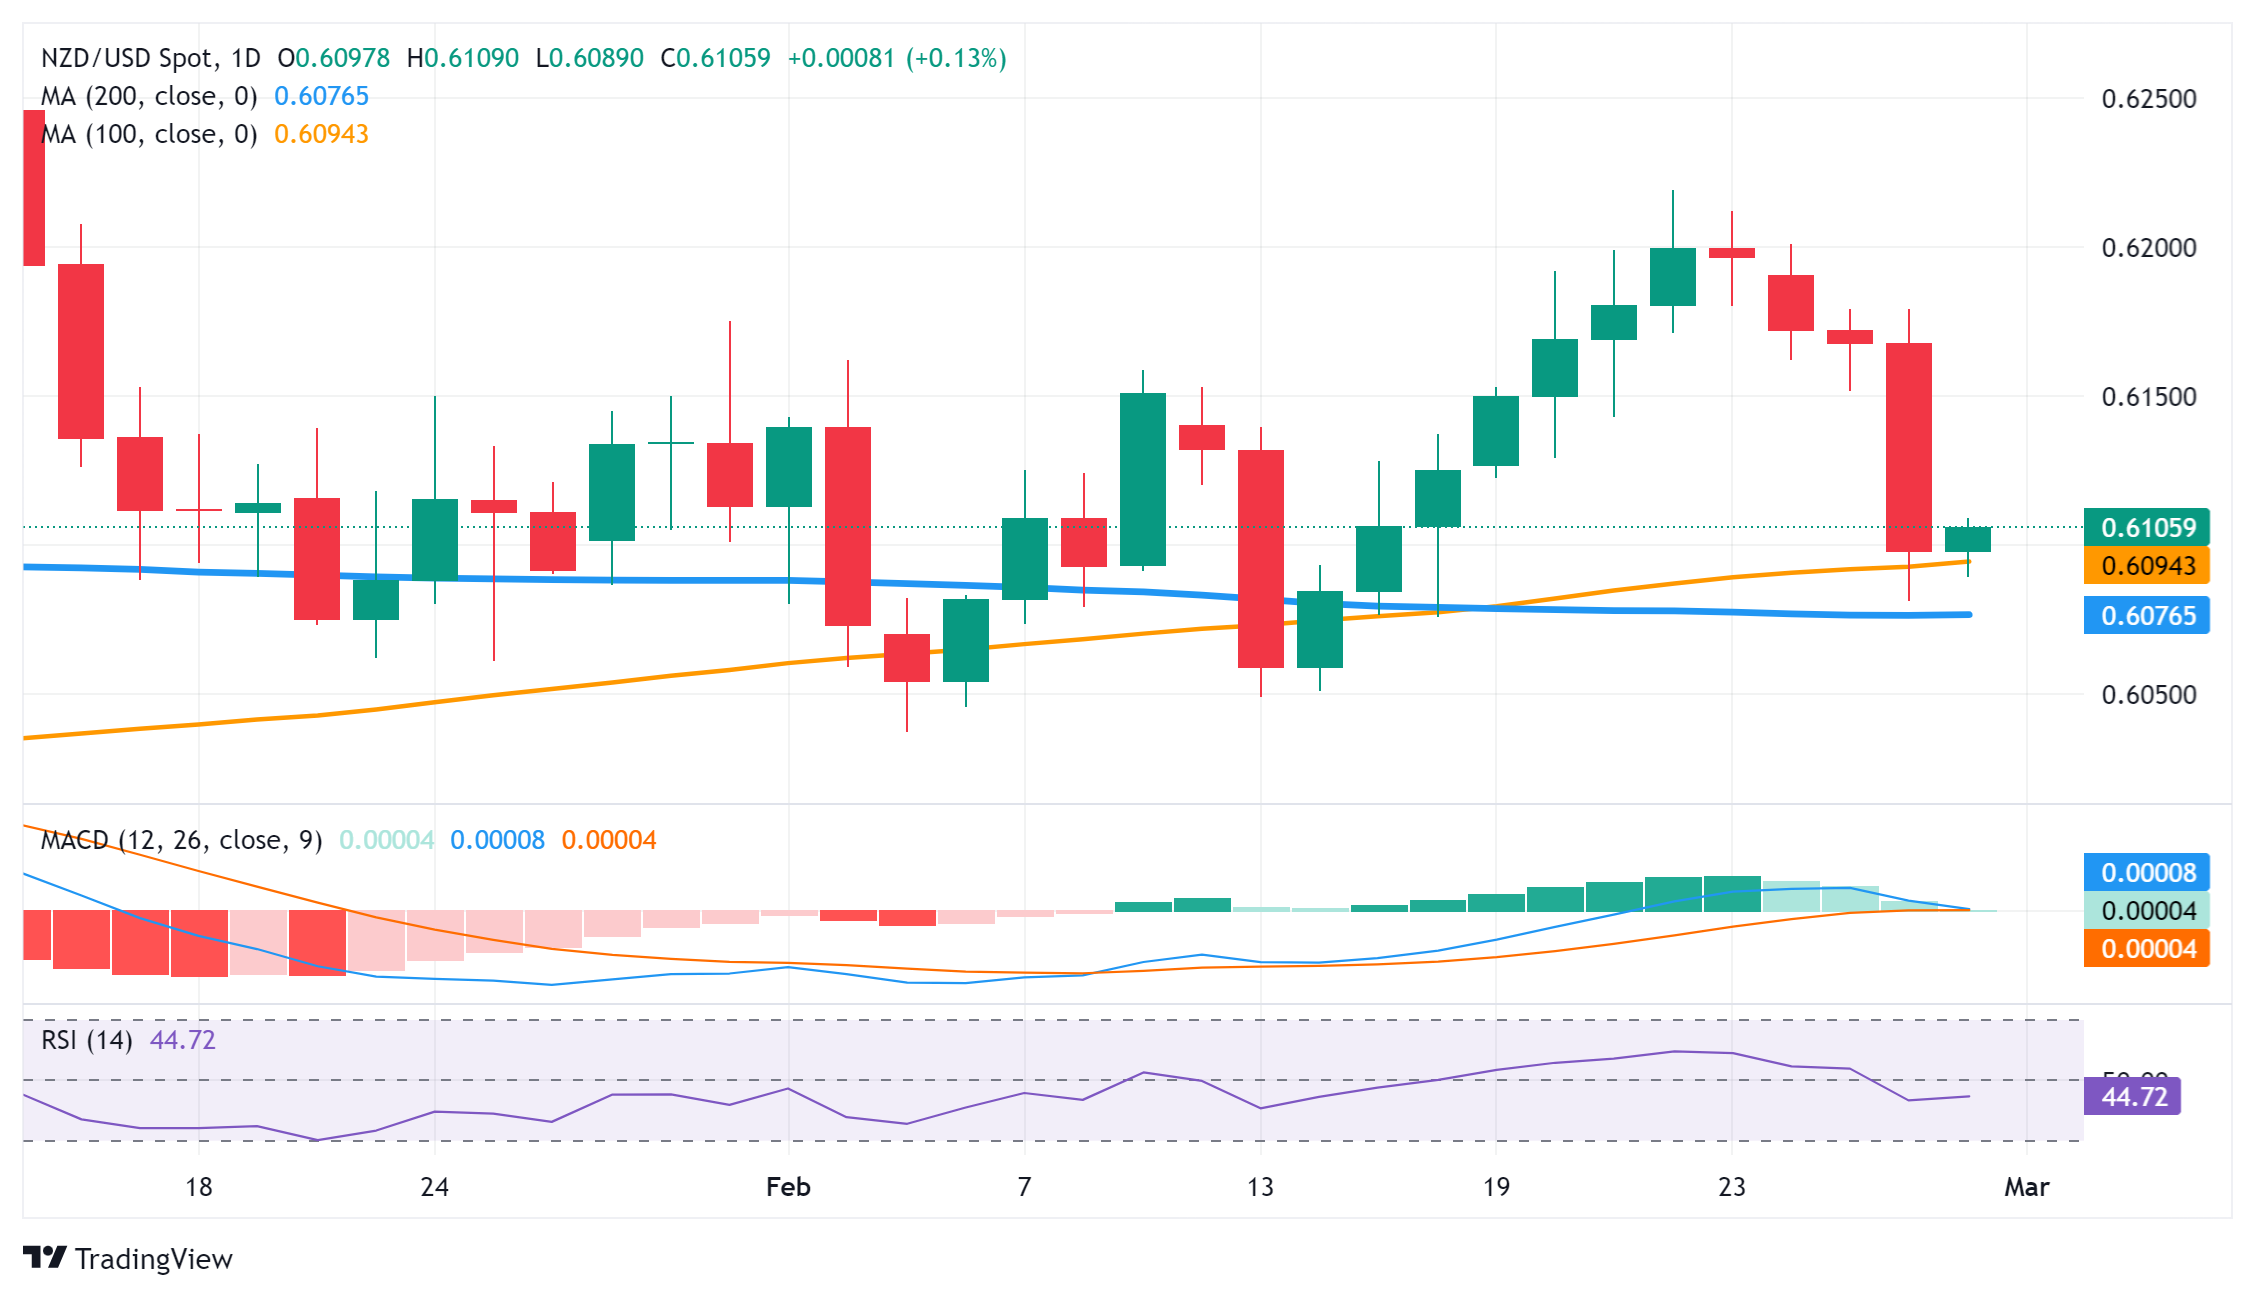
- Acceptance below the 100-day SMA is needed to confirm the negative near-term outlook.
The NZD/USD pair attracts some buying during the Asian session on Thursday and reverses some of the previous day's heavy losses to a 1.5-week low hit following the Reserve Bank of New Zealand's (RBNZ) policy decision. The pair is currently trading around the 0.6100 level, although lacking continuation, as investors eagerly await the release of the US Personal Consumption Expenditure (PCE) price index before opening new directional positions.
Ahead of the key data release, US Dollar (USD) bulls seem reluctant to open aggressive positions and are opting to wait on the sidelines, which in turn lends some support to the NZD/USD pair. That said, the Federal Reserve's (Fed) talk of higher interest rates for longer should help limit any significant decline in the USD. Aside from this, a generally weaker tone around equity markets could benefit the USD's relative safe haven status and cap the risk-sensitive NZD.
From a technical perspective, the RBNZ's subsequent decline showed some resistance below the 100-day SMA and stalled just ahead of the 200-day SMA. The latter is currently near the 0.6080-0.6075 zone and should act as a key point. Since the oscillators on the daily chart have just started to gain negative traction, a convincing break below said support will be seen as a new trigger for the bears and pave the way for deeper losses.
The subsequent decline could drag the NZD/USD pair back towards the yearly low, around the 0.6040-0.6035 area touched in early February, en route to the psychological level of 0.6000. The next relevant support lies near the 0.5965 area, before the pair weakens further below the intermediate support of 0.5940-0.5935, aiming to test sub-0.5900 levels for the first time since November 2023.
On the opposite side, any further recovery is more likely to attract new sellers and remain capped near the horizontal resistance of 0.6140-0.6145. That said, sustained strength above that level could trigger a short covering rally and allow the NZD/USD pair to reclaim the round 0.6200 level. Below is the monthly high, around the 0.6215-0.6220 area that was reached last week and which, if surpassed decisively, will once again tilt the short-term trend in favor of the bulls.
NZD/USD daily chart
Source: Fx Street
I am Joshua Winder, a senior-level journalist and editor at World Stock Market. I specialize in covering news related to the stock market and economic trends. With more than 8 years of experience in this field, I have become an expert in financial reporting.


