
- NZD/USD remains sideways with an eye on the RBNZ policy decision.
- The RBNZ is expected to keep interest rates stable.
- Fed officials do not trust the progress of the disinflation process.
The NZD/USD pair is consolidating in a narrow range of 0.6100-0.6140 for three sessions. NZD/USD is expected to find direction following the Reserve Bank of New Zealand's (RBNZ) interest rate decision announcement on Wednesday.
The RBNZ is expected to keep the official interest rate at 5.5%. Therefore, investors will focus on the direction of interest rates. Given the high inflation in the New Zealand region, the RBNZ is expected to keep interest rates stable for longer. Financial markets currently expect the RBNZ to move into policy normalization in 2025.
Meanwhile, the US Dollar holds the crucial support of 104.50 as the Federal Reserve (Fed) authorities support keeping interest rates at their current levels for a longer period. Early in the American session, Atlanta Fed President Raphael Bostic commented that he is in no rush to cut rates and that he wants to be sure that inflation will not pick up again before considering a rate cut. . When asked about the timetable for rate cuts, Bostic said he doesn't see them before the fourth quarter of this year.
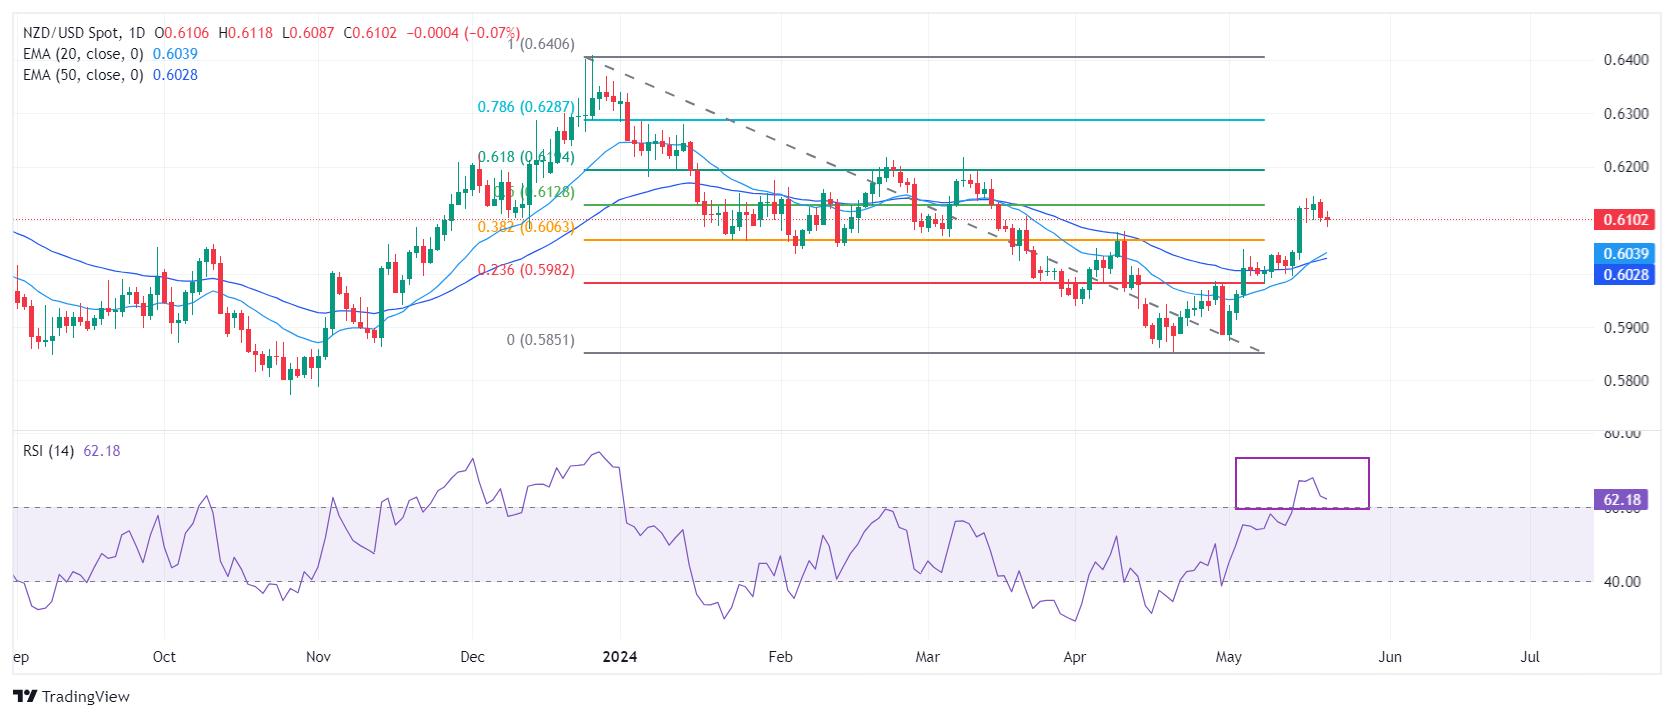
The NZD/USD pair extends its recovery to the 50% Fibonacci retracement (traced from the December 26 high at 0.6410 to the April 19 low around 0.5850) at 0.6130 on the daily time frame. The short-term outlook for the New Zealand asset has improved as the 20-day and 50-day exponential moving averages (EMA) sit around 0.6017. The 14-period RSI has moved comfortably towards the bullish range of 60.00-80.00, suggesting that momentum has tilted to the upside.
A bullish move above the February 9 high at 0.6160 will push the pair towards a 61.8% retracement at 0.6200, followed by the January 15 high near 0.6250
On the contrary, further declines would occur if the pair broke below the April 4 high around 0.6050. This would drag the asset towards the psychological support of 0.6000 and the April 25 high at 0.5969.
NZD/USD daily chart
Source: Fx Street
I am Joshua Winder, a senior-level journalist and editor at World Stock Market. I specialize in covering news related to the stock market and economic trends. With more than 8 years of experience in this field, I have become an expert in financial reporting.


