
- NZD/USD advances to 0.6050 as the attractiveness of risk assets improves.
- The RBNZ is expected to keep the OCR stable at 5.5%.
- US inflation data for March will guide market expectations on Fed rate cuts.
The NZD/USD pair hits more than two-week highs near 0.6055 in the London session on Tuesday. The NZD soars as attractiveness for risk-sensitive assets improves, despite uncertainty ahead of March US Consumer Price Index (CPI) data due on Wednesday.
S&P 500 futures have posted decent gains in the London session, portraying demand for risk-sensitive assets. the 10-year US Treasury yield corrects to 4.40%. The US Dollar falls to 104.00.
According to economists, monthly headline and core inflation data would have increased by 0.3%, above the 0.17% pace needed for inflation to return to the 2% target. Traders would be cautious about betting big on the Federal Reserve (Fed) starting to cut interest rates from its June meeting if inflation data remains higher than expected.
Meanwhile, the New Zealand Dollar strengthens ahead of the Reserve Bank of New Zealand's (RBNZ) interest rate decision, which will be announced on Wednesday. The RBNZ is expected to keep the official interest rate at 5.5%. Therefore, the New Zealand Dollar's next move will be guided by the new interest rate outlook from RBNZ policymakers.
The NZD/USD pair recorded a strong rise after the breakout of the falling wedge pattern formed on a four-hour time frame. The breakout of such a pattern suggests a bullish reversal, exposing the asset to further upside.
Short-term demand turns bullish as the 20-period EMA at 0.6023 tilts higher.
The 14-period Relative Strength Index (RSI) is moving towards the bullish range of 60.00-80.00, indicating strong bullish momentum.
If it breaks the March 6 low at 0.6069, the pair will head towards the March 18 high at 0.6100. If this last level is broken, the asset will head towards the March 12 low at 0.6135.
In an alternative scenario, a bearish move would appear if the pair breaks below the April 5 low at 0.5985. This would drag the asset towards the November 17 low at 0.5940, followed by the round support level of 0.5900.
NZD/USD four-hour chart
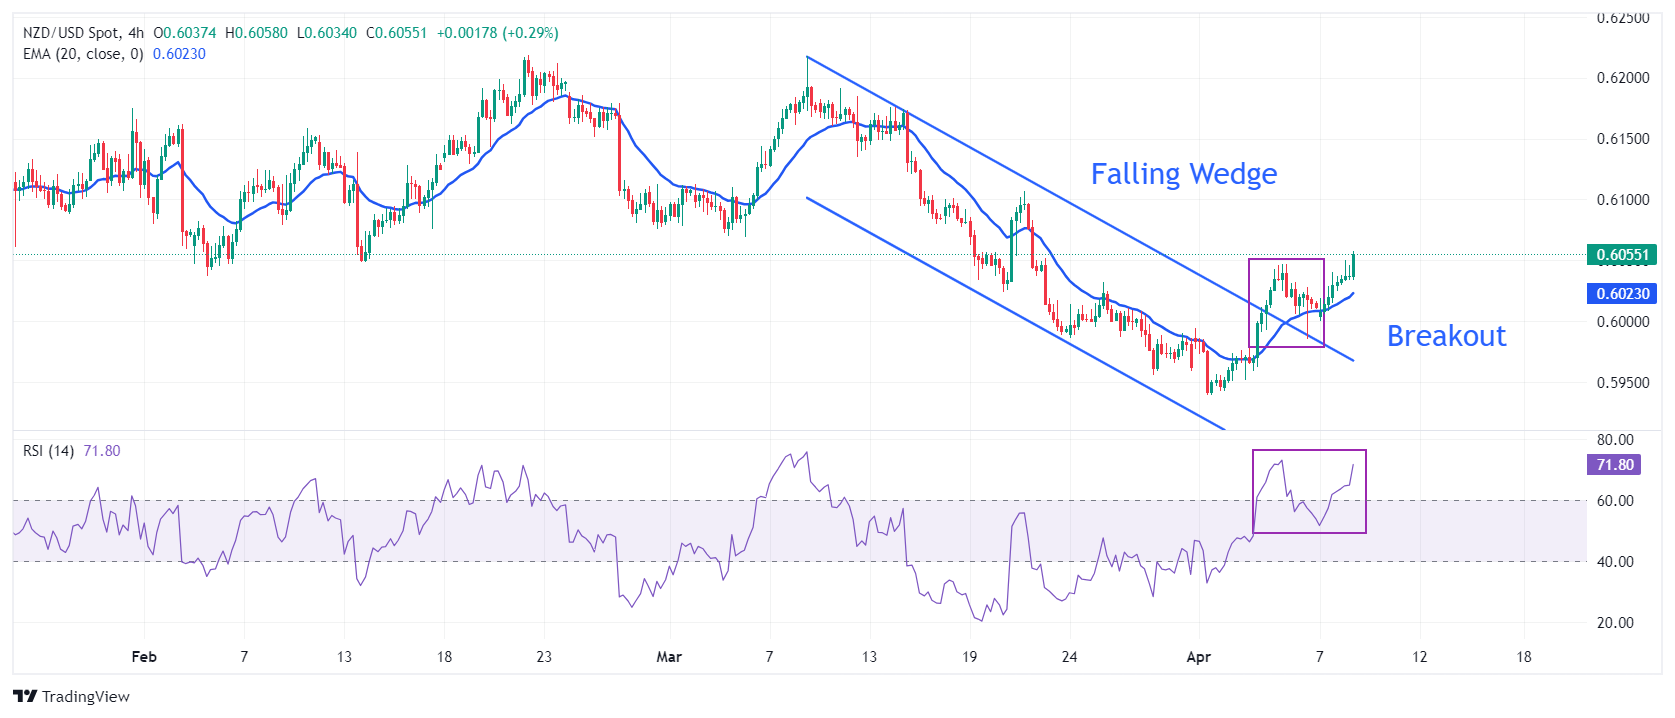
Source: Fx Street
I am Joshua Winder, a senior-level journalist and editor at World Stock Market. I specialize in covering news related to the stock market and economic trends. With more than 8 years of experience in this field, I have become an expert in financial reporting.


