
- NZD/USD falls to new monthly low near 0.6076 as the Fed’s hawkish statements strengthen the appeal of the US Dollar.
- Fed Governor Michelle Bowman expects interest rates to remain stable throughout the year.
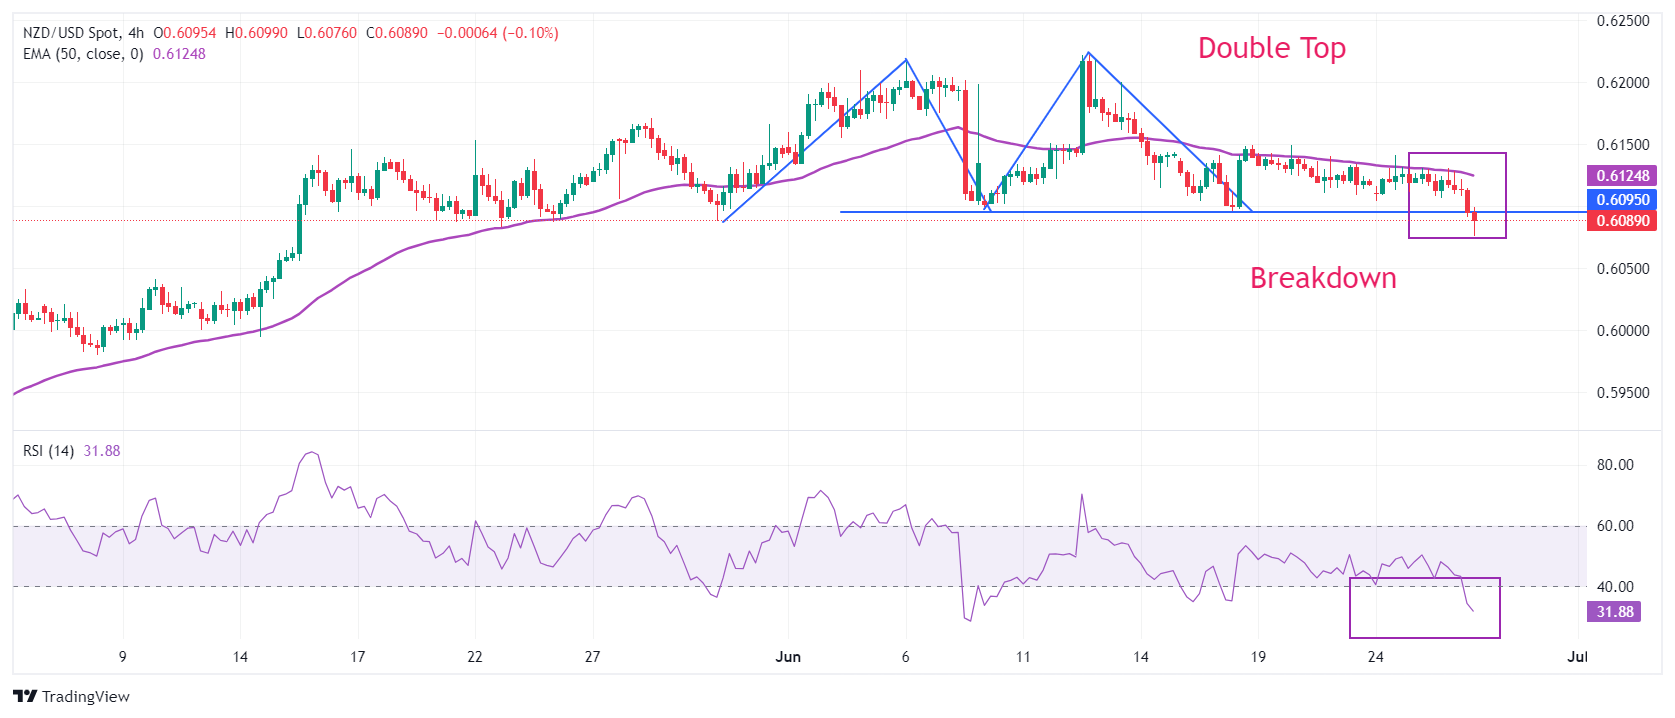
- A downside break of the double top pattern weakens the New Zealand Dollar.
The NZD/USD pair records a new monthly low near 0.6076 in the American session on Wednesday. The NZD/USD pair faces intense selling pressure after breaking below the crucial 0.6100 support. The pair weakens as the US Dollar (USD) strengthens due to hawkish statements from the Federal Reserve (Fed) on the outlook for interest rates.
Fed officials advocate keeping interest rates steady until they get evidence that inflation will return to the desired rate of 2%. On Tuesday, Fed Governor Michelle Bowman postponed hopes for rate cuts next year and warned of further policy tightening if the disinflation process halts or reverses.
Meanwhile, CME’s FedWatch tool shows that traders view the September meeting as the earliest point at which the central bank could begin to dismantle the tightening policy framework.
On the New Zealand front, the Reserve Bank of New Zealand (RBNZ) is expected to keep its official cash rate (OCR) steady at 5.5% throughout the year. Inflation in New Zealand has been falling consistently over the past five quarters, but is still double the required rate of 2%.
NZD/USD shows a downside breakout of the Double Top chart pattern formed on the 4-hour time frame. The breakout of the mentioned chart pattern was triggered after a downside move below the swing low drawn from the low of June 10 near 0.6100, resulting in a bearish reversal.
The 50-period exponential moving average (EMA) near 0.6125 continues to act as a major barrier for the NZD bulls.
The 14-period RSI falls below 40.00. Should bearish momentum trigger the oscillator set below it?
Traders would use a pullback move towards 0.6100 as a selling opportunity to target near the April 4 high around 0.6050 and the psychological support at 0.6000.
Conversely, a reversal move above the June 12 high of 0.6222 will expose the pair to the January 15 high near 0.6250, followed by the January 12 high near 0.6280.
NZD/USD four-hour chart
Economic indicator
CPI ex food and energy (YoY)
The CPI is published on US Labor Department and measures price movements through the comparison between retail prices of a representative basket of goods and services. The purchasing power of the dollar is diminished due to inflation. The CPI is a key indicator for measuring inflation and purchasing trends. Products whose prices have high volatility, such as energy and food, are excluded to capture a more accurate estimate of inflation. A reading above expectations is bullish for the dollar, while a reading below is bearish.
Next post: Thu Jul 11, 2024 12:30
Frequency: Monthly
Dear: –
Previous: 3.4%
Fountain: US Bureau of Labor Statistics
Source: Fx Street
I am Joshua Winder, a senior-level journalist and editor at World Stock Market. I specialize in covering news related to the stock market and economic trends. With more than 8 years of experience in this field, I have become an expert in financial reporting.


