
- Friday’s session saw NZD/USD rise 0.61% to trade around 0.5930.
- The price action shows recent gains and a recovery towards the 20-day SMA, indicating a reversal potential.
- The indicators look promising and are approaching positive areas, so the pair could see further upside.
The NZD/USD pair shot up 0.61% on Friday’s session, continuing the recovery from last week’s lows and reaching 0.5930.
The pair has resumed its upward trajectory, boosted by positive technical indicators. The Relative Strength Index (RSI) has moved close to positive territory around 49, signaling increased buying pressure and bullish sentiment. Additionally, the Moving Average Convergence/Divergence (MACD) indicator shows an ascending green histogram, further confirming the bullish momentum.
The Kiwi pair’s recent rally has seen it conquer the 20-day SMA of 0.5905, signaling bullish reversal potential. However, the persistent bearish crossover between the 100-day and 200-day SMA at 0.6060 raises concerns about the sustainability of the gains. Positive technical indicators, including the RSI and MACD, suggest that buying pressure is increasing and support bullish momentum.
NZD/USD Daily Chart
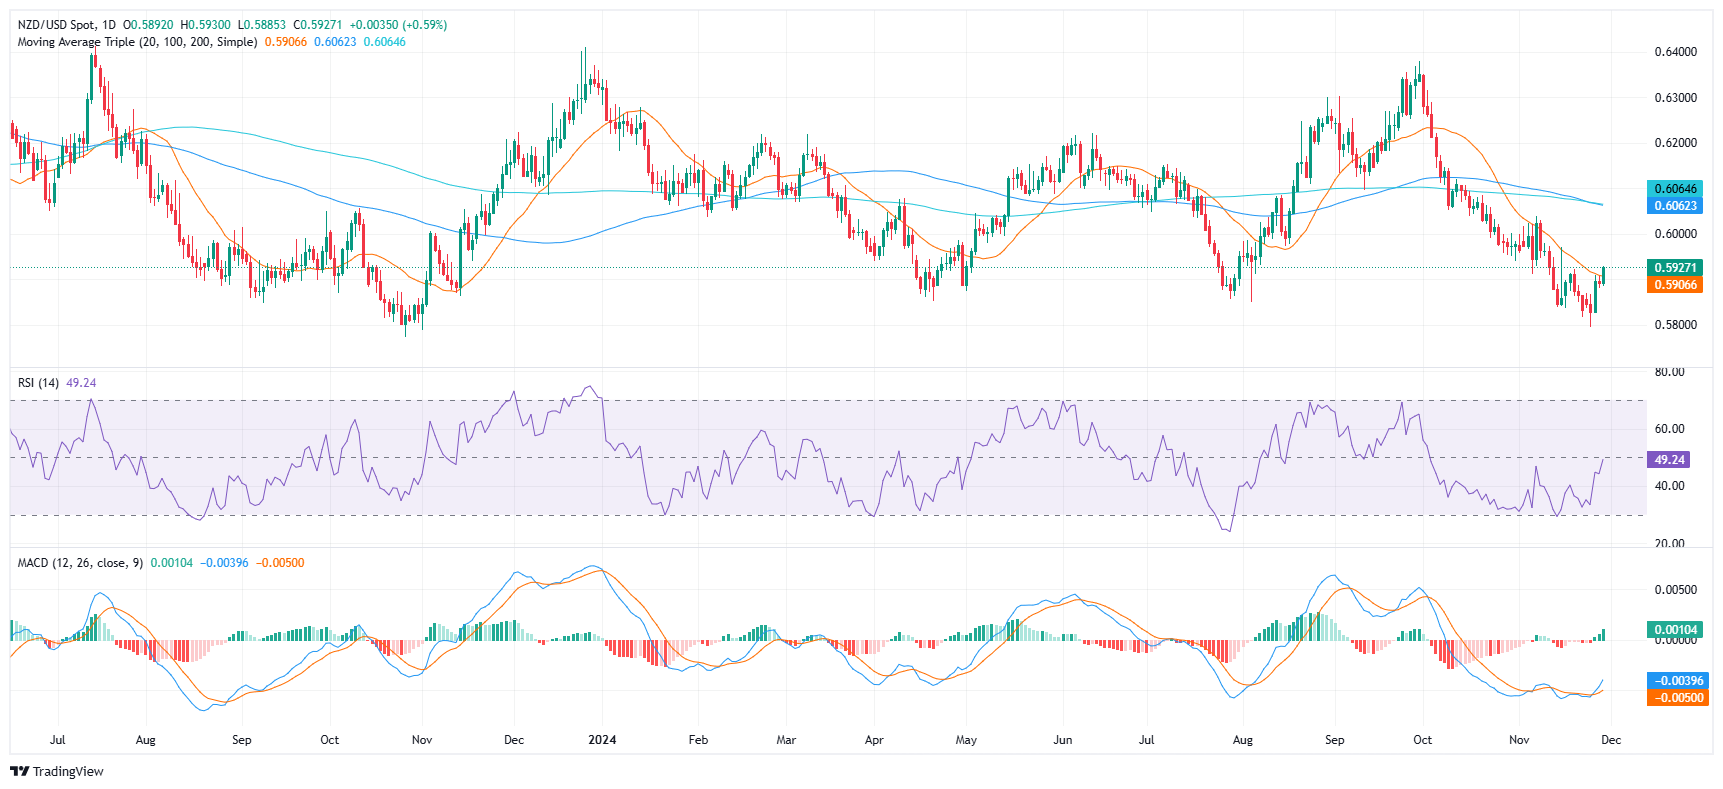
Source: Fx Street
I am Joshua Winder, a senior-level journalist and editor at World Stock Market. I specialize in covering news related to the stock market and economic trends. With more than 8 years of experience in this field, I have become an expert in financial reporting.


