
- NZD/USD declines on Tuesday, retreating to 0.5800 after failing to reclaim the 20-day SMA.
- The pair faces strong rejection at the 20-day SMA, falling to new lows not seen since November 2023.
- The RSI declines sharply into negative territory, while the MACD histogram shows weakening bullish momentum with decreasing green bars.
The NZD/USD pair faced renewed selling pressure on Tuesday, falling 1.14% to 0.5800 following a failed attempt to reclaim the 20-day Simple Moving Average (SMA). The rejection at this key resistance level highlights the pair’s inability to reverse its downtrend, taking it to new lows not seen since November 2023.
Technical indicators reinforce the bearish sentiment. The Relative Strength Index (RSI) has dropped sharply to 39, remaining in negative territory and signaling intensifying selling pressure. Similarly, the histogram of the Moving Average Convergence/Divergence (MACD) indicator displays decreasing green bars, suggesting weakening bullish momentum and a lack of signs of recovery.
With the pair now trading near the critical 0.5800 psychological support level, downside risks remain elevated. A break below this level could pave the way for further declines, potentially targeting the 0.5770-0.5750 range. To the upside, the 20-day SMA at 0.5890 remains the key barrier, with a decisive break above it necessary to change the outlook to neutral or bullish.
NZD/USD daily chart
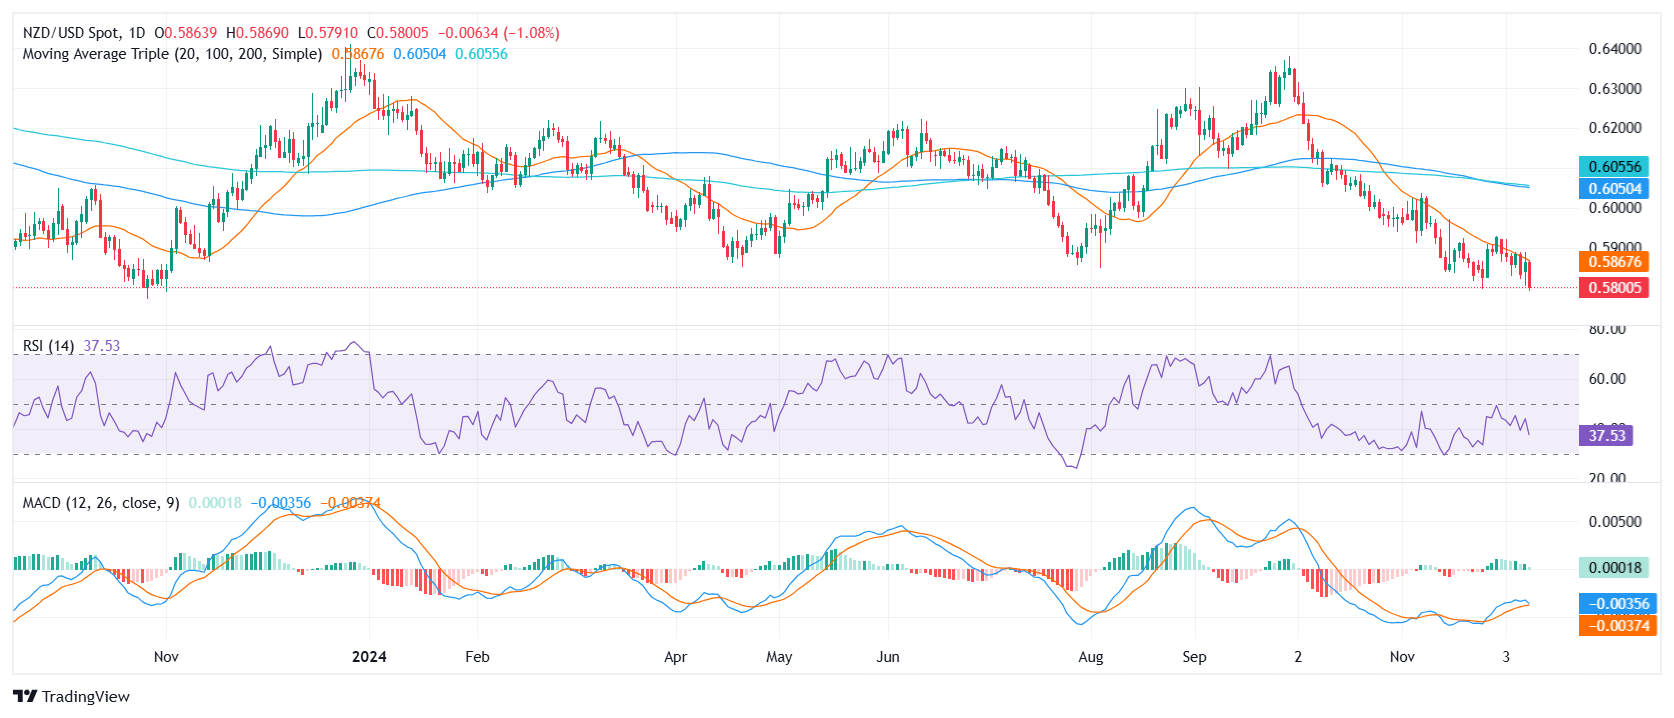
Source: Fx Street
I am Joshua Winder, a senior-level journalist and editor at World Stock Market. I specialize in covering news related to the stock market and economic trends. With more than 8 years of experience in this field, I have become an expert in financial reporting.


