
- The NZD/USD pair has pulled back slightly around 0.6150 on the back of a nice DXY rally.
- New Zealand’s quarterly GDP contracted 0.1% versus a previous contraction of 0.6%.
- More persistence in US core inflation could accelerate the chances of a further Fed rate hike.
The pair NZD/USD has seen its bullish momentum halted around 0.6150 in the European session. The Kiwi has faced delicate barriers while the Dollar Index (DXY) has attempted a solid recovery. High volatility is expected in the DXY as investors are anxious about US inflation and the Federal Reserve (Fed) interest rate decision.
The DXY has shown a solid rebound after testing territory below 103.30 as general sentiment is mixed on interest rate policy. Investors will continue to watch US Consumer Price Index (CPI) data and further persistence in core inflation could accelerate the chances of a further Fed rate hike.
As for the NZD, first quarter gross domestic product (GDP) will continue to be the focus. Quarterly GDP contraction of 0.1% is forecast, compared to a previous contraction of 0.6%. On an annualized basis, economic data is expected to grow 2.6%, up from the previous contraction of 2.2%.
The NZD/USD pair has broken above the horizontal resistance drawn from the April 26 low at 0.6111, which has become a cushion for Kiwi bulls. The downtrend line drawn from the May 11 high at 0.6385 is acting as a barrier for the NZD.
Also, the 200 EMA at 0.6147 is restricting the NZD from any move higher.
The Relative Strength Index (RSI) (14) has drifted towards the bullish range of 60.00-80.00, indicating that bullish momentum has been activated.
A safe break above the May 1 low at 0.6160 will propel the Kiwi towards round level resistance at 0.6200, followed by the May 17 high at 0.6261.
Alternatively, a move below the intraday low at 0.6015 would expose the asset to a fresh 6-month low towards the 11 Nov 2022 low at 0.5984. A drop below the latter would expose the asset towards the November 2, 2022 high at 0.5941.
NZD/USD 4-hour chart
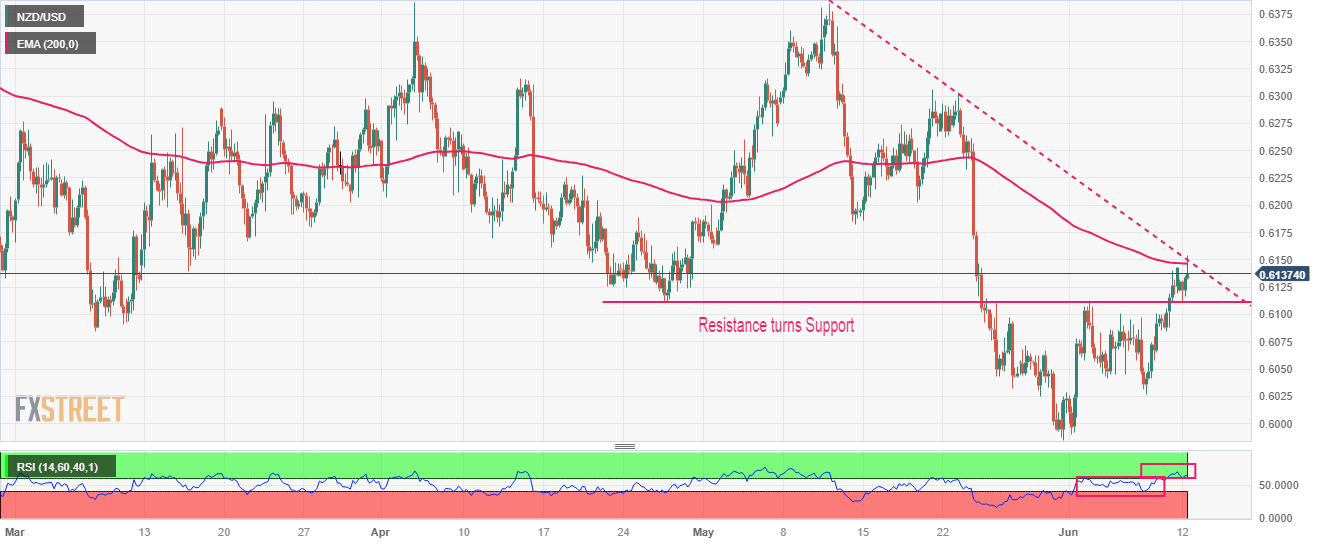
Source: Fx Street
I am Joshua Winder, a senior-level journalist and editor at World Stock Market. I specialize in covering news related to the stock market and economic trends. With more than 8 years of experience in this field, I have become an expert in financial reporting.


