
- NZD/USD consolidates amid rising geopolitical tensions following the Iranian attack on Israel.
- Technical analysis suggests confirmation of tepid momentum for the pair.
- The 0.5950 level appears as the immediate barrier, followed by the 23.6% Fibo level at 0.5996 and the psychological level of 0.6000.
NZD/USD is moving back and forth amid rising geopolitical tensions in the Middle East after Iran attacked Israel on Saturday by launching explosive drones and missiles targeting military installations. However, the Israeli military successfully intercepted most of the incoming projectiles, according to Reuters. The pair consolidates around 0.5940 during the European session on Monday.
According to Moving Average Convergence Divergence (MACD) analysis, a bearish sentiment prevails on NZD/USD. This is evidenced by the MACD line positioned below the center line and the signal line, signaling a bearish trend.
Additionally, the 14-day Relative Strength Index (RSI) is below the 50 level, providing additional confirmation of the bearish sentiment, which could prompt NZD/USD traders to navigate the region around to the psychological level of 0.5900. A break below the latter could influence the NZD/USD pair to approach new support at the 0.5850 level.
To the upside, the pair could find immediate resistance at the main level of 0.5950. A break above this level could lead the pair to test a strong resistance zone around the 23.6% Fibonacci retracement level of 0.5996, aligned with the psychological level of 0.6000 and the exponential moving average. (14-day EMA) of 0.6001.
NZD/USD: Daily Chart
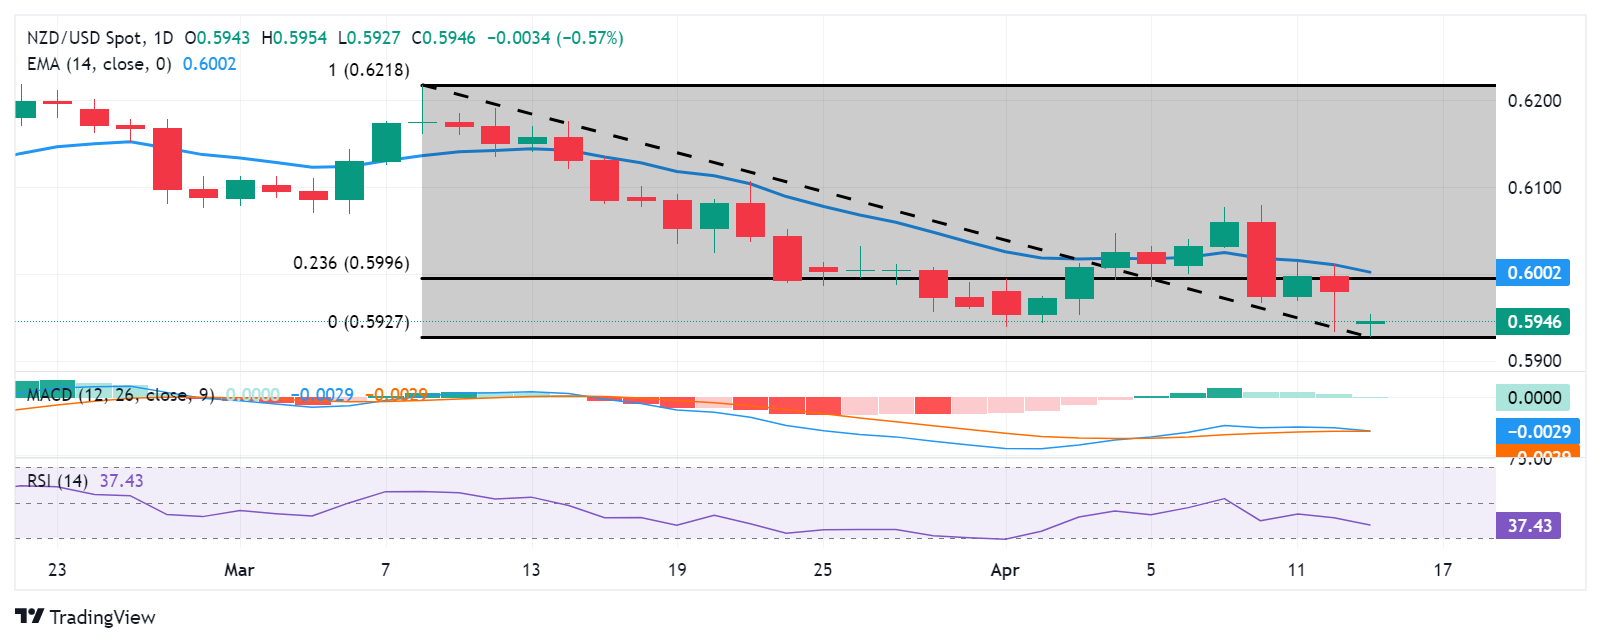
Source: Fx Street
I am Joshua Winder, a senior-level journalist and editor at World Stock Market. I specialize in covering news related to the stock market and economic trends. With more than 8 years of experience in this field, I have become an expert in financial reporting.


