
- NZD/USD falls in a three-wave ABC pattern with wave C reaching within one pip of its bearish target.
- The MACD is turning higher in a bullish move that could signal a change in the trend cycle.
NZD/USD has fallen in wave C of a bearish ABC pattern that began at the September 30 highs.
ABCs are zigzag patterns in which waves A and C are usually of similar length or 61.8% Fibonacci of each other.
NZD/USD daily chart
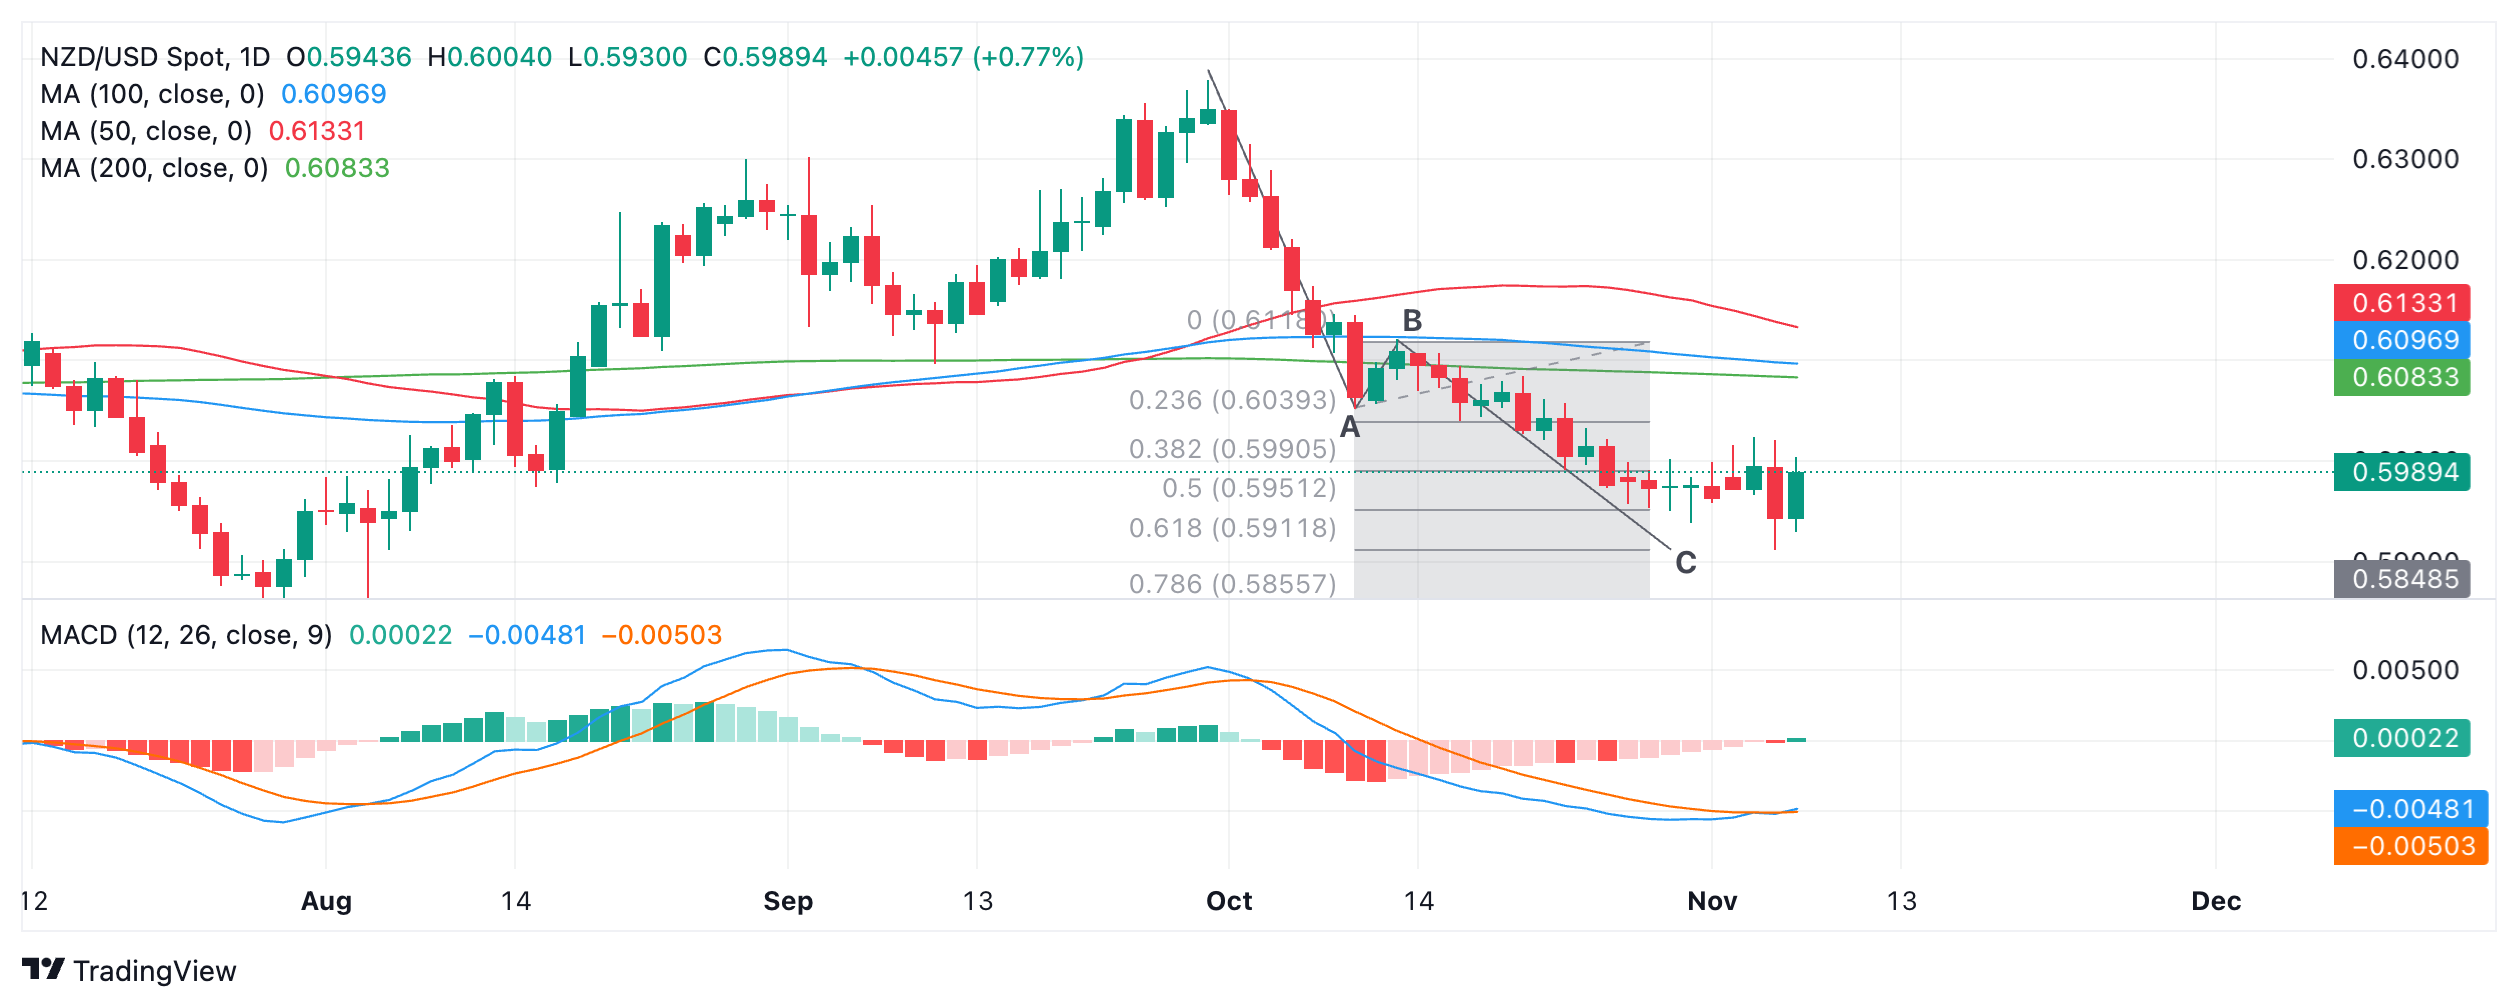
NZD/USD fell to 0.5912 on November 6, one pip above the estimated low endpoint of wave C at 0.5911 as 61.8% of the length of A. We may be able to take this as the pair reaching its target given that a pip is within a margin of error, however, it is also possible that it could still fall further and adequately reach the bearish target.
In a truly bearish scenario, the Kiwi pair could even fall to the main support level at 0.5849 (Aug 5 low).
The pair remains in a bearish trend in the short and medium term, and given the theory of technical analysis that “the trend is your friend”, it is biased to continue declining. In the long term, the pair is in a sideways trend consolidation.
The Moving Average Convergence/Divergence (MACD) momentum indicator line (blue) is rotating above its red signal line, giving a fairly strong buy signal. This is a bullish signal and could indicate that short and medium term trends are turning upwards, however, it is still too early to be sure. If NZD/USD is about to turn higher, it would be roughly in line with the pair reaching the bottom of the long-term range.
Source: Fx Street
I am Joshua Winder, a senior-level journalist and editor at World Stock Market. I specialize in covering news related to the stock market and economic trends. With more than 8 years of experience in this field, I have become an expert in financial reporting.


