
- NZD/USD is steadily declining in what could be the last wave of a large zig-zag pattern.
- It is not yet oversold and could reach lower lows given the short and medium-term bearish trends.
NZD/USD is falling in what could be wave C of a bearish ABC pattern that started at the September 30 highs.
ABCs are zig-zag patterns in which waves A and C are usually of similar length or 61.8% Fibonacci of each other.
NZD/USD daily chart
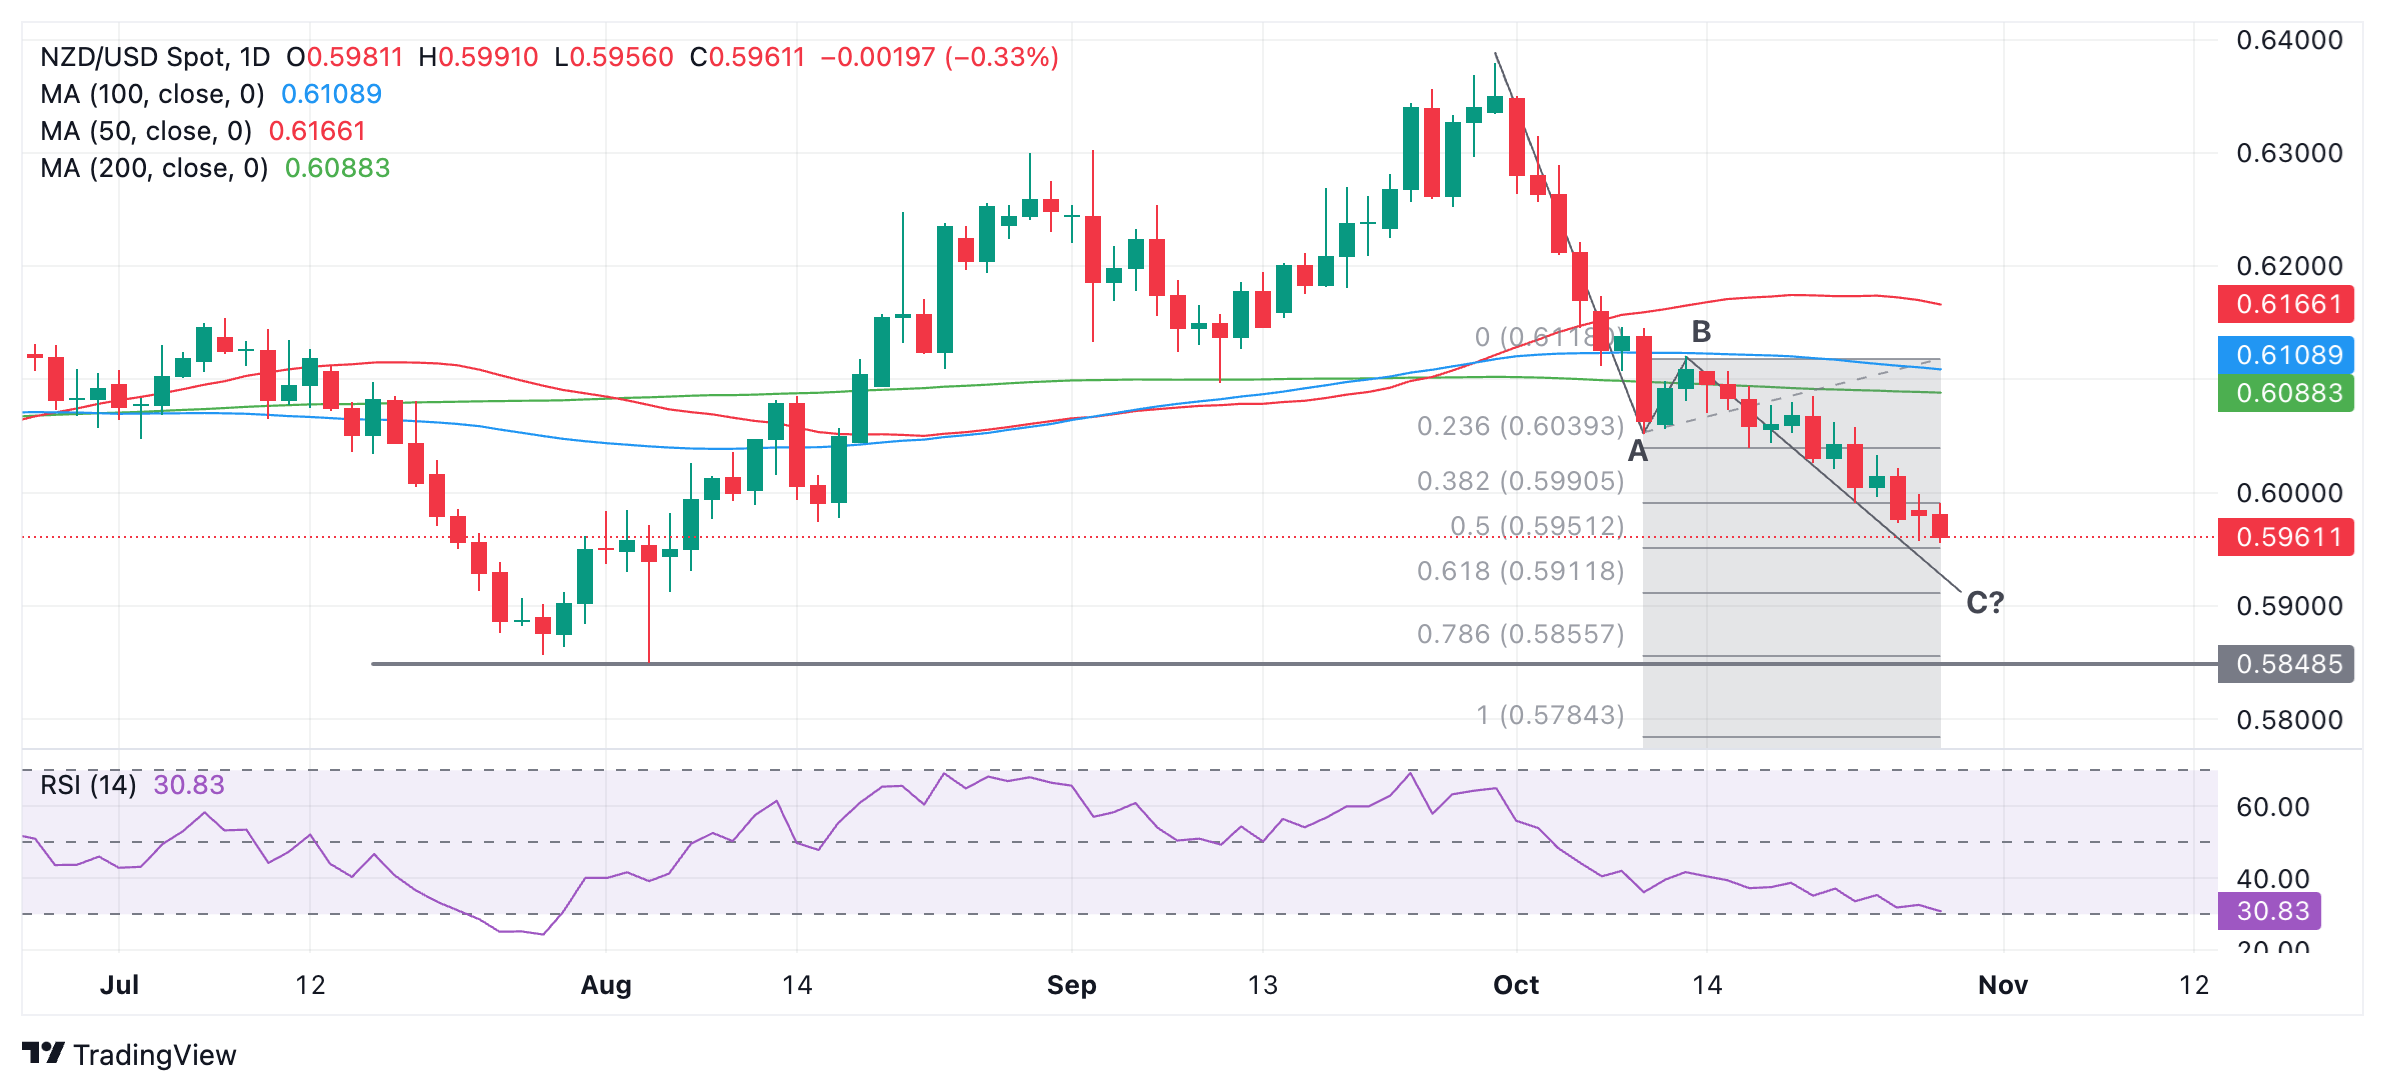
NZD/USD will likely fall to a target at 0.5911, the point where wave C is 61.8% of A. A break below the 0.5956 low would provide confirmation.
It is possible that it could fall to the main support level at 0.5849 (Aug 5 low). A truly bearish move could even see an extension to 0.5784, the point where wave C=A.
The outlook is supported by the fact that the pair is in a short and medium-term downtrend and “the trend is your friend.” However, the Kiwi pair is in a long-term sideways consolidation.
The Relative Strength Index (RSI) momentum indicator is not yet oversold (below 30), suggesting there could be more decline to come. When it reaches oversold, traders will be advised not to add to their existing short positions.
Source: Fx Street
I am Joshua Winder, a senior-level journalist and editor at World Stock Market. I specialize in covering news related to the stock market and economic trends. With more than 8 years of experience in this field, I have become an expert in financial reporting.


