
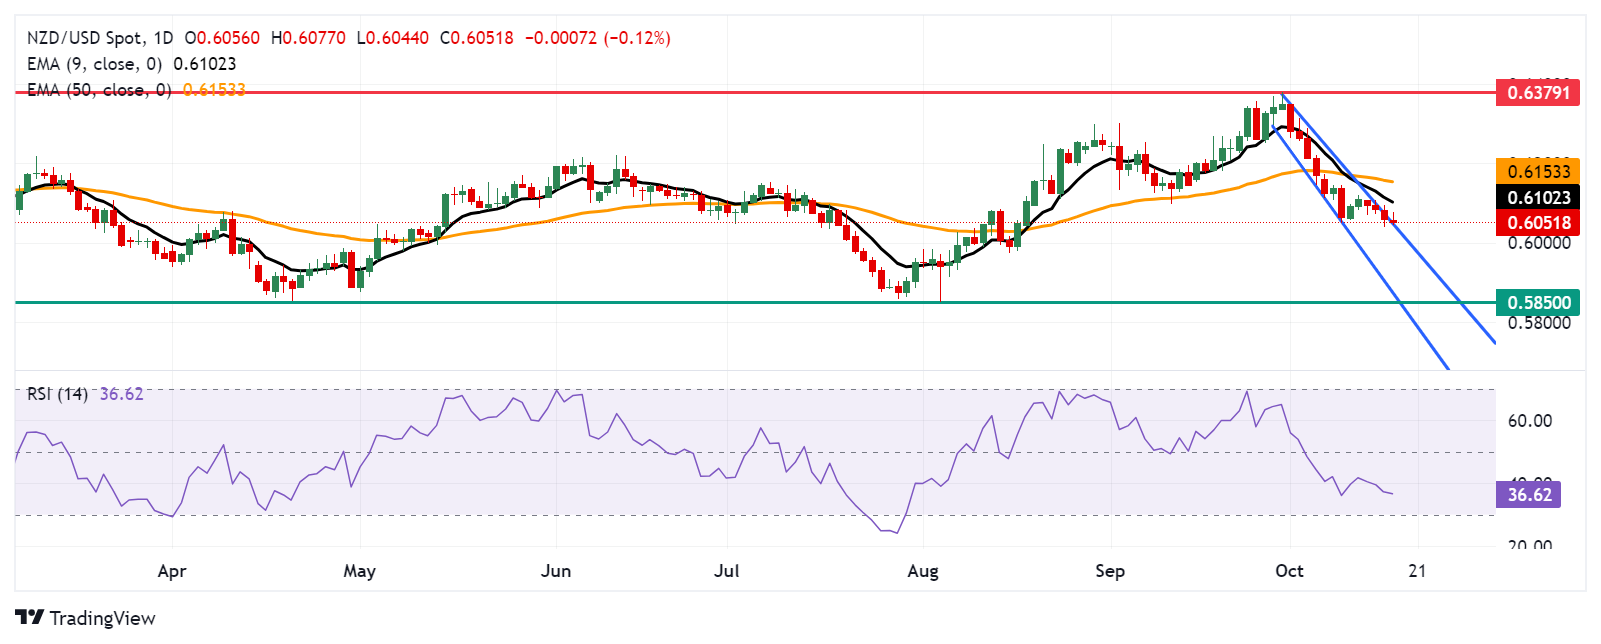
- NZD/USD tries to stay within the descending channel pattern.
- If the 14-day RSI falls below the 30 level, it would indicate oversold territory and the possibility of a short-term bullish correction.
- Immediate resistance appears at the nine-day EMA at the 0.6101 level, followed by the 50-day EMA at the 0.6153 level.
NZD/USD continues its losing streak for the fourth consecutive day, hovering around 0.6050 during the European trading session on Thursday. Analysis of the daily chart shows that the pair is trying to stay within the descending channel pattern, signaling a continuation of the downtrend.
The 14-day Relative Strength Index (RSI) is approaching the 30 level, reinforcing the current bearish sentiment. A drop below this threshold would indicate that the NZD/USD pair is oversold, which could lead to a short-term bullish correction. Furthermore, the nine-day exponential moving average (EMA) remains below the 50-day EMA, highlighting the weakness in the near-term price trend for the pair.
In terms of support, if the NZD/USD pair manages to re-enter the descending channel, it could test the area around the lower boundary at the 0.5880 level, followed by “pullback support” near the 0.5850 level.
To the upside, immediate resistance is at the nine-day exponential moving average (EMA) around the 0.6102 level, followed by the 50-day EMA at the 0.6153 level. A break above these levels could change the outlook to bullish, potentially allowing the NZD/USD pair to target the 16-month high of 0.6379, which was last reached on September 30.
NZD/USD: Daily Chart
New Zealand Dollar PRICE Today
The table below shows the percentage change of the New Zealand Dollar (NZD) against major currencies today. New Zealand dollar was the weakest currency against the Australian dollar.
| USD | EUR | GBP | JPY | CAD | AUD | NZD | CHF | |
|---|---|---|---|---|---|---|---|---|
| USD | 0.10% | 0.04% | 0.06% | 0.23% | -0.15% | 0.07% | -0.03% | |
| EUR | -0.10% | -0.07% | 0.00% | 0.14% | -0.25% | 0.00% | -0.12% | |
| GBP | -0.04% | 0.07% | 0.04% | 0.19% | -0.19% | 0.05% | -0.04% | |
| JPY | -0.06% | 0.00% | -0.04% | 0.17% | -0.22% | -0.02% | -0.07% | |
| CAD | -0.23% | -0.14% | -0.19% | -0.17% | -0.37% | -0.14% | -0.23% | |
| AUD | 0.15% | 0.25% | 0.19% | 0.22% | 0.37% | 0.23% | 0.14% | |
| NZD | -0.07% | -0.01% | -0.05% | 0.02% | 0.14% | -0.23% | -0.09% | |
| CHF | 0.03% | 0.12% | 0.04% | 0.07% | 0.23% | -0.14% | 0.09% |
The heat map shows percentage changes for major currencies. The base currency is selected from the left column, while the quote currency is selected from the top row. For example, if you choose the New Zealand Dollar from the left column and move along the horizontal line to the US Dollar, the percentage change shown in the box will represent the NZD (base)/USD (quote).
Source: Fx Street
I am Joshua Winder, a senior-level journalist and editor at World Stock Market. I specialize in covering news related to the stock market and economic trends. With more than 8 years of experience in this field, I have become an expert in financial reporting.


