
- NZD/USD could find support around the lower boundary of the descending channel at the 0.5800 level.
- A corrective bounce is possible once the 14-day RSI falls below the 30 level.
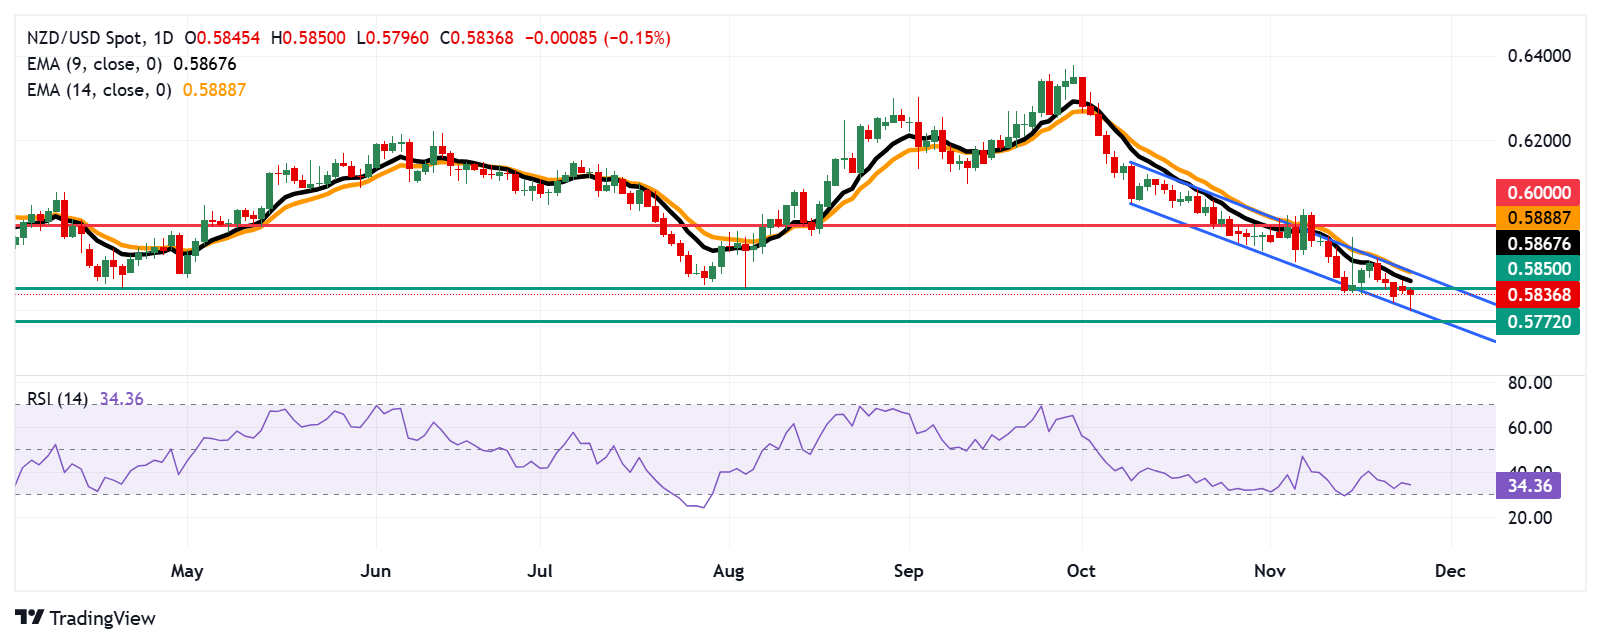
- The nine-day EMA at 0.5867 would act as an immediate barrier.
NZD/USD extends its losing streak for the fifth consecutive day, trading around 0.5840 during European trading hours on Tuesday. A review of the daily chart highlights a deepening bearish trend as the pair moves within a descending channel pattern.
The nine-day exponential moving average (EMA) remains below the 14-day EMA, signaling persistent weakness in near-term price momentum. Furthermore, the 14-day Relative Strength Index (RSI) remains just above the 30 level, reflecting the prevailing bearish sentiment. A drop below 30 would indicate oversold conditions, which could pave the way for a corrective bounce.
Regarding its support, the NZD/USD pair tests the psychological level of 0.5800, which coincides with the lower boundary of the descending channel. A decisive break below this level would strengthen the bearish outlook, increasing downward pressure and potentially taking the pair towards its two-year low of 0.5772, last seen in November 2023.
To the upside, immediate resistance lies at the nine-day EMA around 0.5867, followed by the 14-day EMA at 0.5888, which aligns with the upper boundary of the descending channel. A break above this channel could weaken the bearish momentum and pave the way for the pair to test the 0.6000 psychological resistance level.
NZD/USD: Daily Chart
New Zealand Dollar PRICE Today
The table below shows the percentage change of the New Zealand Dollar (NZD) against major currencies today. New Zealand dollar was the weakest currency against the Japanese yen.
| USD | EUR | GBP | JPY | CAD | AUD | NZD | CHF | |
|---|---|---|---|---|---|---|---|---|
| USD | 0.18% | 0.21% | -0.17% | 1.01% | 0.36% | 0.13% | 0.10% | |
| EUR | -0.18% | 0.02% | -0.34% | 0.82% | 0.18% | -0.05% | -0.10% | |
| GBP | -0.21% | -0.02% | -0.35% | 0.80% | 0.16% | -0.07% | -0.12% | |
| JPY | 0.17% | 0.34% | 0.35% | 1.17% | 0.52% | 0.27% | 0.24% | |
| CAD | -1.01% | -0.82% | -0.80% | -1.17% | -0.64% | -0.87% | -0.90% | |
| AUD | -0.36% | -0.18% | -0.16% | -0.52% | 0.64% | -0.24% | -0.26% | |
| NZD | -0.13% | 0.05% | 0.07% | -0.27% | 0.87% | 0.24% | -0.04% | |
| CHF | -0.10% | 0.10% | 0.12% | -0.24% | 0.90% | 0.26% | 0.04% |
The heat map shows percentage changes for major currencies. The base currency is selected from the left column, while the quote currency is selected from the top row. For example, if you choose the New Zealand Dollar from the left column and move along the horizontal line to the US Dollar, the percentage change shown in the box will represent the NZD (base)/USD (quote).
Source: Fx Street
I am Joshua Winder, a senior-level journalist and editor at World Stock Market. I specialize in covering news related to the stock market and economic trends. With more than 8 years of experience in this field, I have become an expert in financial reporting.


