
- NZD/USD is repeatedly pushing against the top of a range that began in the spring.
- A break above the August 20 high would form a higher high and confirm a range breakout.
- Such a move would be expected to lead to substantial follow-through higher.
NZD/USD continues to touch the top of the sideways range it established since spring. A break above the August 20 high would likely confirm an upside breakout with substantial gains expected thereafter.
NZD/USD daily chart
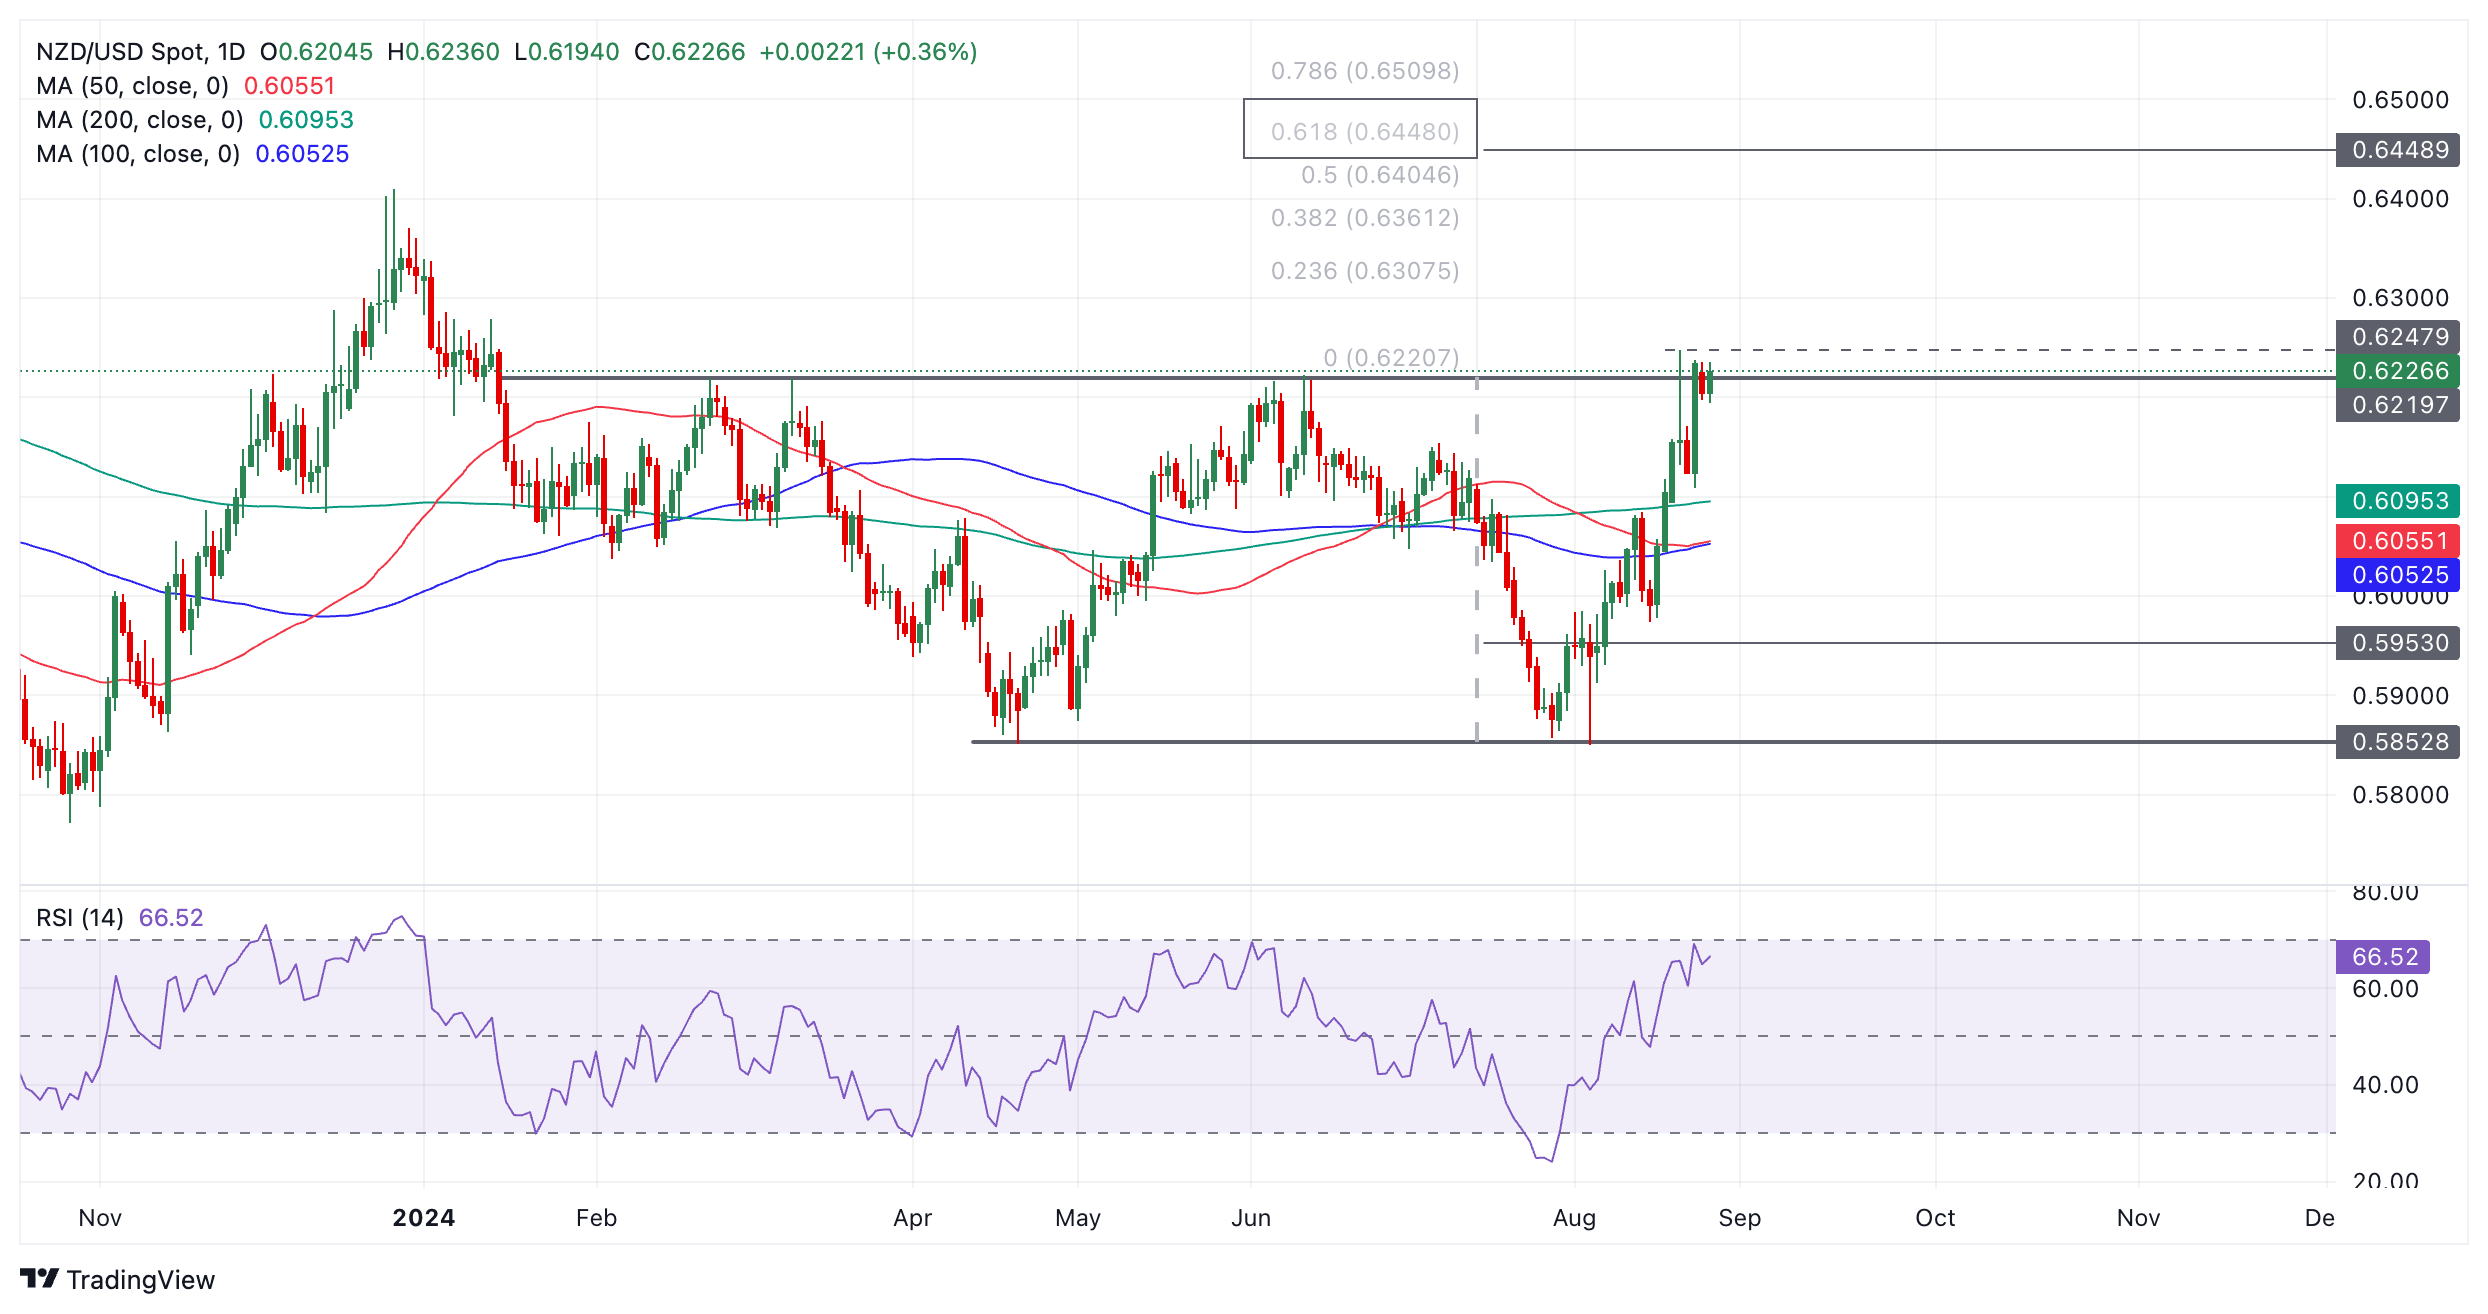
The pair temporarily broke the top of its range on August 20 when it rose to a high of 0.6248 before rapidly falling and forming a bearish Doji candlestick in the process. This was followed by a bearish red candlestick which was expected to signal further weakness in the near term, however, the pair fell a few points to the swing low of 0.6109 on August 22.
Since then, NZD/USD has recovered and continues to test the top of the range.
A break above the 0.6248 highs of August 20 would signal a decisive breakout of the confines of the range. Such a move would then trigger an upside target, calculated by taking the ratio of 0.618 to the height of the range and extrapolating it upwards. This would give an upside target of 0.6448 (bold rectangle). Another more conservative target is found at 0.6409 (December 2023 high).
Such a move would also likely change the short-term trend from sideways to bullish.
A break below the swing low of 0.6109 (August 23 low), however, would reconfirm the sideways trend as intact. This would likely see the pair move back towards the range bottom around 0.5850.
Source: Fx Street
I am Joshua Winder, a senior-level journalist and editor at World Stock Market. I specialize in covering news related to the stock market and economic trends. With more than 8 years of experience in this field, I have become an expert in financial reporting.


