
- NZD/USD is moving lower within a descending channel pattern, reinforcing a bearish bias.
- The nine-day EMA continues below the 14-day EMA, adding to the prevailing bearish sentiment.
- The pair could target the lower boundary of the descending channel around the 0.5930 level.
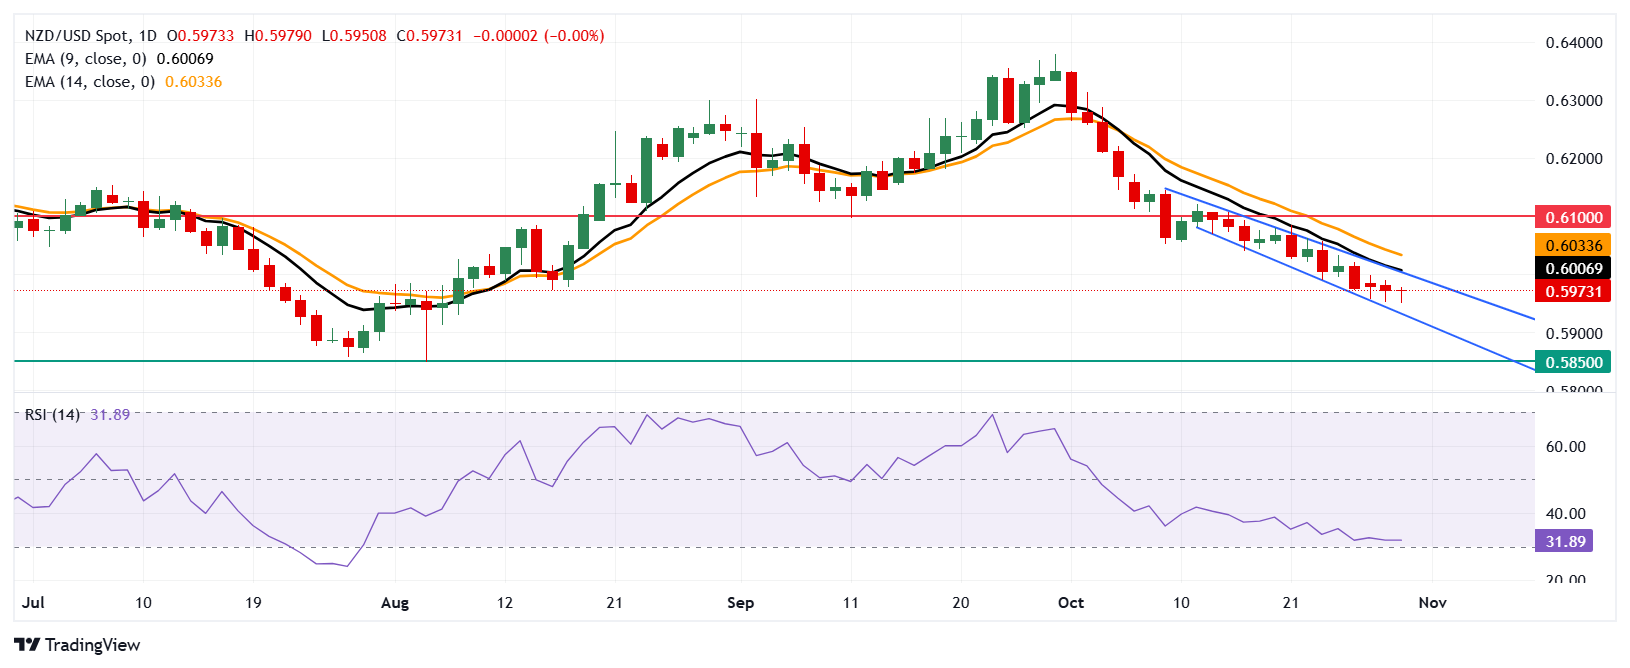
The NZD/USD pair remains warm for the fourth consecutive session, trading around 0.5970 during the European session on Wednesday. The daily chart analysis shows a downward movement within a descending channel, indicating a bearish bias.
Adding to this outlook, the nine-day exponential moving average (EMA) remains below the 14-day EMA, further supporting the bearish sentiment for the NZD/USD pair. Short-term momentum appears weak, suggesting continued bearish pressure.
The 14-day Relative Strength Index (RSI), a key momentum indicator, currently holds just above the 30 mark. A drop below this level would signal an oversold condition, which could indicate an upcoming correction on the rise for the NZD/USD pair.
On the downside, the NZD/USD pair could target the lower boundary of the descending channel around the 0.5930 level. A decisive break below this support could take the pair towards the “pullback support” near 0.5850.
As for resistance, the initial hurdle is the upper boundary of the descending channel, near the nine-day exponential moving average around 0.6006, followed by the 14-day EMA at 0.6033. A sustained move above these EMAs could shift the NZD/USD pair to a bullish stance in the near term, potentially targeting the psychological level of 0.6100.
NZD/USD: Daily Chart
New Zealand Dollar PRICE Today
The table below shows the percentage change of the New Zealand Dollar (NZD) against major currencies today. The New Zealand Dollar was the weakest currency against the Swiss Franc.
| USD | EUR | GBP | JPY | CAD | AUD | NZD | CHF | |
|---|---|---|---|---|---|---|---|---|
| USD | -0.00% | 0.07% | -0.02% | 0.02% | 0.06% | 0.00% | -0.08% | |
| EUR | 0.00% | 0.08% | 0.00% | 0.03% | 0.06% | 0.01% | -0.07% | |
| GBP | -0.07% | -0.08% | -0.08% | -0.06% | -0.02% | -0.07% | -0.13% | |
| JPY | 0.02% | 0.00% | 0.08% | 0.03% | 0.07% | 0.00% | -0.06% | |
| CAD | -0.02% | -0.03% | 0.06% | -0.03% | 0.03% | -0.01% | -0.08% | |
| AUD | -0.06% | -0.06% | 0.02% | -0.07% | -0.03% | -0.04% | -0.13% | |
| NZD | -0.01% | -0.01% | 0.07% | -0.01% | 0.01% | 0.04% | -0.07% | |
| CHF | 0.08% | 0.07% | 0.13% | 0.06% | 0.08% | 0.13% | 0.07% |
The heat map shows percentage changes for major currencies. The base currency is selected from the left column, while the quote currency is selected from the top row. For example, if you choose the New Zealand Dollar from the left column and move along the horizontal line to the US Dollar, the percentage change shown in the box will represent the NZD (base)/USD (quote).
Source: Fx Street
I am Joshua Winder, a senior-level journalist and editor at World Stock Market. I specialize in covering news related to the stock market and economic trends. With more than 8 years of experience in this field, I have become an expert in financial reporting.


