
- Manufacturing activity weakened for the eighth consecutive month, weighing on the dollar.
- Investors expect a Fed rate hike in July despite weak data, while chances of a November hike dwindle.
- The New Zealand Dollar (NZD) is expected to be guided by the upcoming Reserve Bank of Australia (RBA) monetary policy decision, with expectations for a 25 basis point rate hike to 4.35%.
He NZD/USD advances as the third quarter, the second half of the year, begins as worse-than-expected data in the United States (US) reignited recession fears as business activity slowed. This, coupled with a deep inversion of the 10yr – 2yr US yield curve, indicates that traders are bracing for a recession amid a cycle of rising borrowing costs from investors. central banks to curb inflation. The NZD/USD pair is trading at 0.6156 after hitting a daily low of 0.6115.
Worse-than-expected US data revives recession fears and supports NZD/USD; yield curve inversion raises concern
The US Institute of Supply Management (ISM) revealed that manufacturing activity weakened further in June, to 46.0, down from 46.9 in May, missing estimates of 47. According to the report, it is the eighth month consecutive losses. The data showed that the prices paid on the manufacturing front are being deflated, unlike in services, which remained on the rise due to higher wage growth due to the rigidity of the labor market.
Despite weaker-than-expected data, investors believe the US Federal Reserve (Fed) will raise rates in July as odds of a 25 basis point hike according to CME’s FedWatch tool stood at around 87%. However, the odds for November fell to 33% after the data.
NZD/USD traders should note that the latest data put aside fears of a Recession, but last Friday’s US inflation report tempered speculation that the Fed will hike rates twice in the future. End of the year. That weighed on the dollar, which, according to the Dollar Index (DXY), is holding firm at 102.979, despite yields continuing to fall.
The US yield curve inverted the most since March 2023 at -1.078% as the US 2-year yield is 4.923% while the 10-year yield is 3.843%, a sign that market players expect further Fed tightening to slow the economy, and could push it into a recession.
For its part, the New Zealand economic agenda was light, as no data was reported. However, the New Zealand dollar (NZD) is expected to receive signals from the Reserve Bank of Australia’s (RBA) monetary policy decision. On Tuesday, the RBA is expected to hike rates by 25 basis points to 4.35%, though the odds are 50/50, according to a Reuters poll, with 16 of 31 economists expecting the hike while the rest see a pause. .
upcoming events
During the week, the New Zealand agenda will include the NZIER business trust. In the US, the ISM and S&P Global PMI indices will be released, along with Fed data, factory orders, the May FOMC minutes and crucial labor market data.
NZD/USD Price Analysis: Technical Perspective
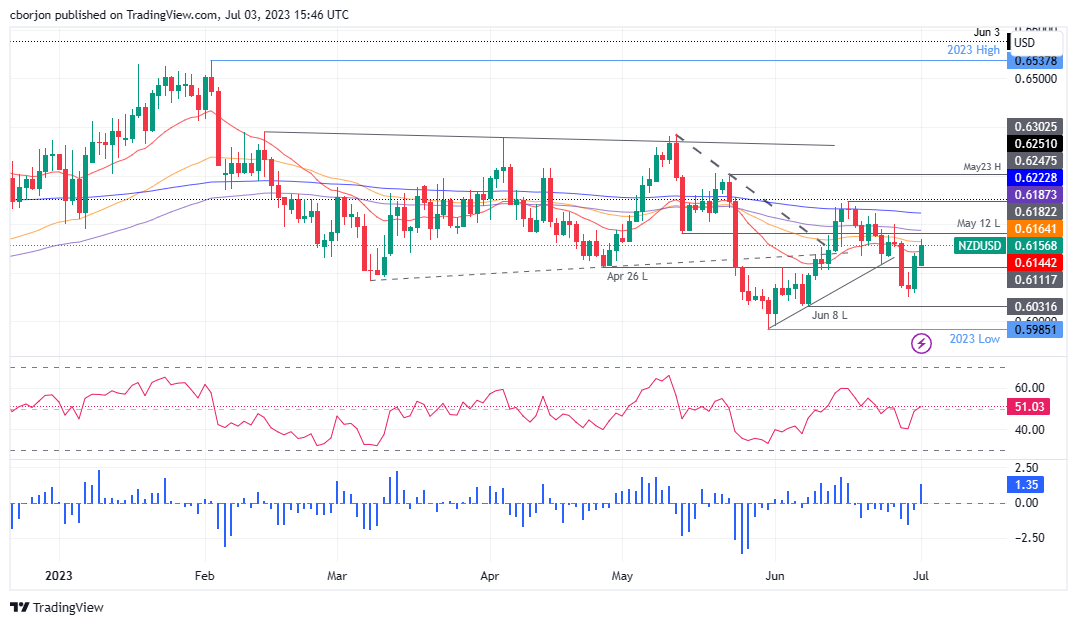
The daily chart of the NZD/USD pair shows that investors tested the 50 day EMA at 0.6164 but failed to hold above, suggesting that sellers are still in command. Furthermore, NZD buyers were unable to break a downtrend resistance trend line from two weeks ago, a further sign that NZD/USD would remain exposed to sellers. In that case, the first support for NZD/USD would be the 20-day EMA at 0.6144, followed by 0.6100, before testing the June 30 daily low at 0.6059. On the other hand, if buyers of the NZD/USD recapture the 50 day EMA, key resistance levels will be exposed, such as the 100 day EMA at 0.6187, the 0.6200 figure and the 200 day EMA at 0.6222.
Source: Fx Street
I am Joshua Winder, a senior-level journalist and editor at World Stock Market. I specialize in covering news related to the stock market and economic trends. With more than 8 years of experience in this field, I have become an expert in financial reporting.


