
- NZD/USD falls from last week’s highs around 0.6468 on risk aversion.
- The looming economic slowdown in China and the disappointing New York Fed Empire State Index underpin the US dollar.
- The Reserve Bank of New Zealand is expected to raise rates by 50 basis points on Wednesday.
NZD/USD breaks five days of gains and falls from last week’s highs on mixed sentiment, spurred on by weak Chinese economic data coupled with a gloomy New York Fed Empire State Manufacturing Index, which weakened slightly to the dollar.
At time of writing, NZD/USD is trading above 0.6363, shedding 1.21%, after hitting a daily high at 0.6456, before plummeting towards daily lows at 0.6355, as traders seek safety earlier. of the release of the FOMC minutes on Wednesday.
US stocks rise, buoyed by big tech companies. In the currency space, haven pairs remain in control after Chinese industrial production and retail sales data missed estimates. The PBoC reacted to the figures, cutting the one-year MLF rates from 2.85% to 2.75%, amid growing concerns that the country may miss its 5% target by the end of the year.
Meanwhile, early in the US session, the Empire State Manufacturing Index for August was in contraction territory, at -31.3 from the 5 point estimate, causing a setback in the Dollar Index. , which fell to 106.00 before resuming its recovery towards 106.40, up 0.69%.
What to watch out for?
Having said that, NZD/USD outlook tilts lower. However, a 50 basis point rise by the RBNZ on Wednesday would limit the Kiwi’s declines to lower levels. For NZD/USD buyers it is crucial to keep the exchange rate above 0.6395; if not, a drop to the daily high of 1st August, which has become support, at 0.6350 is expected before opening the door to further losses.
In the United States, the economic calendar will include FOMC minutes, US housing data, initial jobless claims, the Conference Board’s leading index and Fed statements.
NZD/USD daily chart
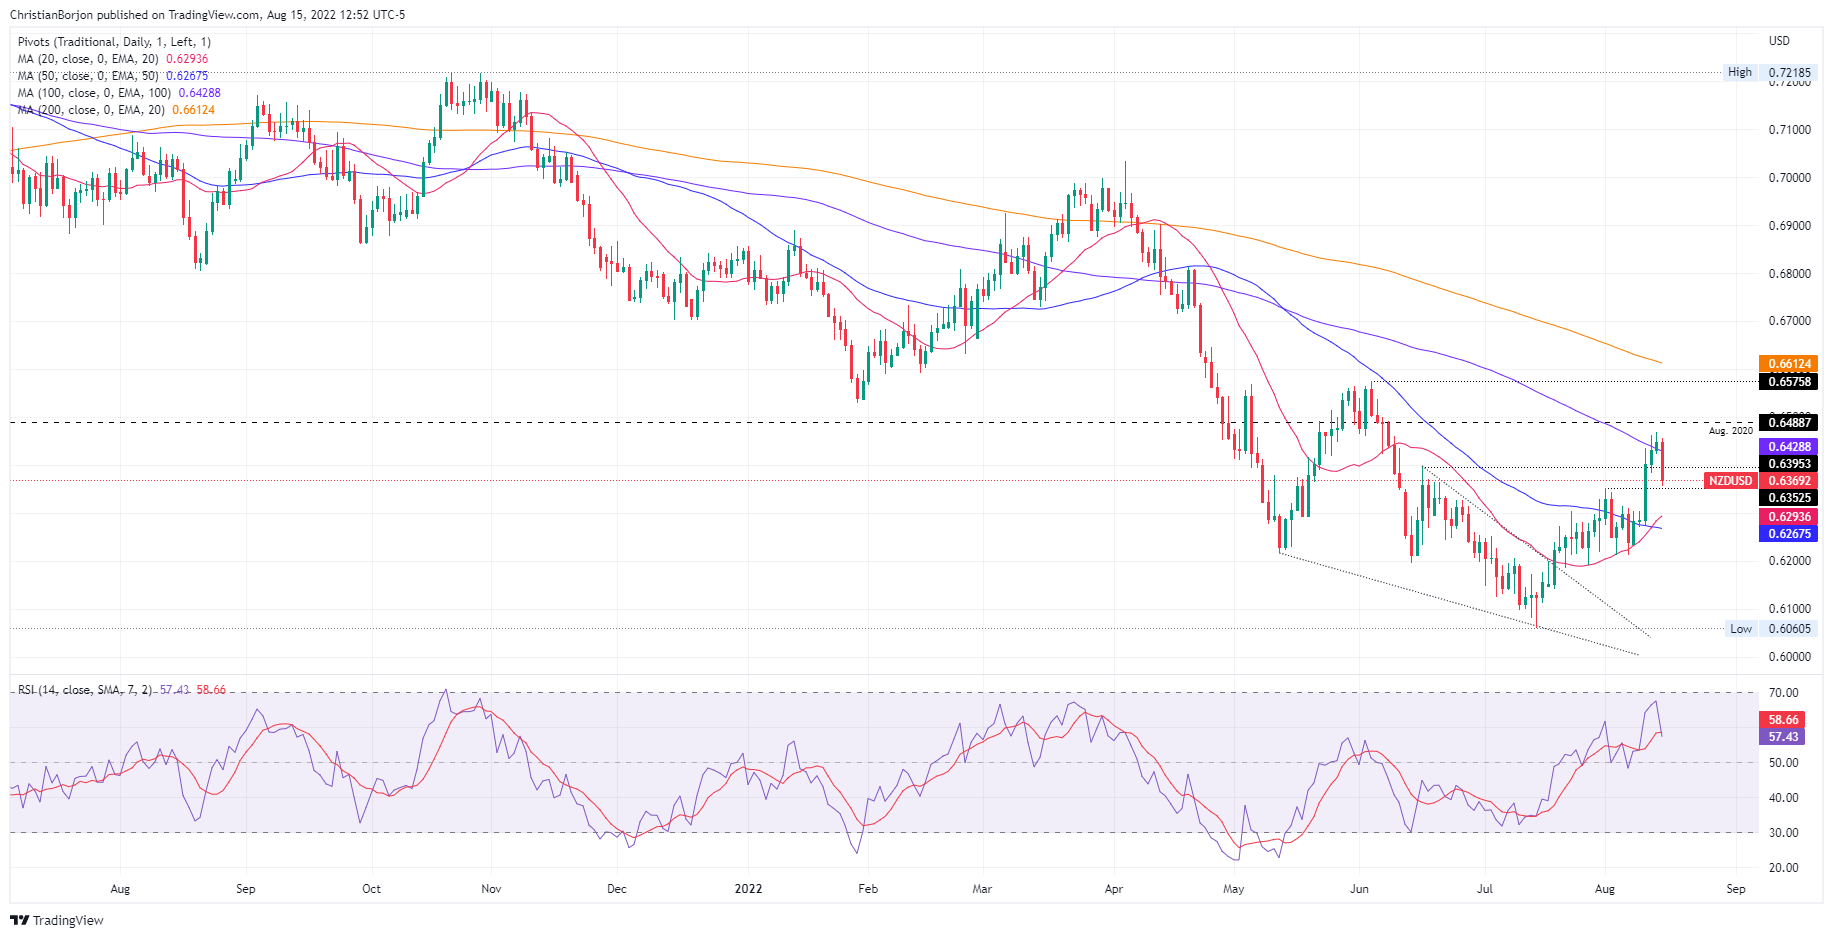
NZD/USD Key Technical Levels
Source: Fx Street
With 6 years of experience, I bring to the table captivating and informative writing in the world news category. My expertise covers a range of industries, including tourism, technology, forex and stocks. From brief social media posts to in-depth articles, I am dedicated to creating compelling content for various platforms.


