
- Crude oil markets are in full swing due to headlines about the Houthis.
- EIA US crude oil production increases on a net basis, albeit with some regional declines.
- Canadian crude oil production rises as Trans Mountain nears completion.
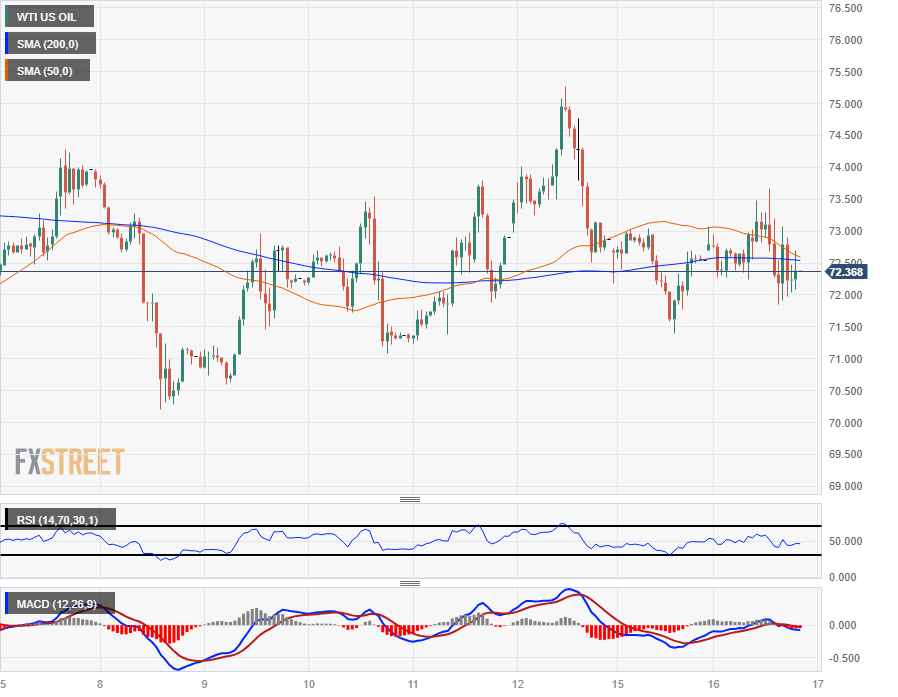
American crude oil West Texas Intermediate (WTI) was see-saw on Tuesday, consolidating just above $72 a barrel, as geopolitical concerns surrounding Houthi attacks on civilian cargo ships in the Red Sea continue to underpin barrel bids in a market action fearful and unequal.
Iran-backed Houthi rebels continue to vow to attack civilian cargo ships heading to the Suez Canal past Yemen's coast, and assault by US-UK coalition naval forces raises fears energy operators that Houthi rebels continue to attack ships passing through the important waterway connecting Europe and Asia.
Despite concerns about supply lines, US crude oil stocks remain well supplied and oil and gas pipelines remain full.
US and Canadian production continues to reach historic highs
According to the Energy Information Administration (EIA), US net crude oil production increased slightly this week, after Permian Basin production rose 5.5 billion barrels per day to 5.974 million bpd, further boosting the US crude oil production despite the slight decrease in production from the Eagle Ford production center (2 billion bpd less, to 1,147 million bpd) and the Bakken oil production center (500 bpd less, to 1,303 million bpd).
U.S. Oil Production Continues to Far Outpace Organization of the Petroleum Exporting Countries (OPEC) Production Cuts, and North American Crude Oil Production Set to Increase Even Further with Increased Production from Canadian oil producers as the Trans Mountain pipeline nears completion. As reported by The Canadian Press via BNN Bloomberg, Alberta's oil production reached a record 4.2 million barrels per day in November, 8.8% more than the previous month. In comparison, Alberta produced an average of 3.8 million bpd through the first eleven months of 2023.
The increase in Canadian crude oil production in November makes Canada the world's fourth largest producer of barrels.
WTI Technical Outlook
US WTI crude oil continues to trade in the mid-range around the 200-hour SMA near $72.50, while barrel bids continue to shuffle key levels, looking for definitive momentum in either direction .
Long-term upside potential is waning as WTI trades sideways at a declining 50-day SMA, and bullish momentum sees a technical top at the 200-day SMA at $78.00.
WTI is up a scant 5.7% from December lows near $67.97, and the limited recovery has US crude oil still down nearly 24% from last September's highs near $94.00.
WTI hourly chart
WTI Daily Chart
WTI technical levels
Source: Fx Street
I am Joshua Winder, a senior-level journalist and editor at World Stock Market. I specialize in covering news related to the stock market and economic trends. With more than 8 years of experience in this field, I have become an expert in financial reporting.


