
- Oil retreats to $78.00 after a failed attempt to break $80.00 on Friday.
- More criticism is emerging around the world against Israel and its strategy in Gaza.
- The US Dollar Index remains stable around 105.30, awaiting this week's US CPI data.
Oil prices rise slightly on Monday, but levels are in the red after closing almost flat last week. The black gold has not been able to rally due to increased tensions in the Middle East, after the US suspended the supply of certain weapons to Israel amid concerns about the Rafah offensive. Meanwhile, speculation is mounting that OPEC+ may not end its voluntary production cuts at its next meeting in June.
Meanwhile, the US Dollar Index (DXY) is in the middle of a two-week range around 105.30 and is looking for direction. Traders are beginning to see possibilities ranging from a soft landing to a stagflation scenario. On Wednesday, markets will look to the US Consumer Price Index (CPI) numbers to see if the higher-than-expected inflation numbers recorded in the first quarter extend into April.
At the time of writing, crude oil (WTI) is trading at $78.06 and Brent crude oil is trading at $82.70.
Oil news and market movements: Further relaxation
- Arab News reports that several oil traders confirmed that part of the recent correction is due to the prospects of lower demand linked to the US Federal Reserve (Fed) maintaining interest rates for longer. . A rate cut would give a boost to the economy and therefore oil demand.
- On Monday, Goldman Sachs released a report saying it no longer expects OPEC+ to announce a partial reduction in voluntary production cuts at its June meeting.
- Bloomberg reports that crude oil storage afloat on tankers has fallen 11% since last week. This would be the lowest level since February 2020 at just 55.92 million barrels as of May 10.
Technical analysis of oil: hanging by a thread
Oil prices are turning on some red lights as they trade around a risk level. With oil prices right on the green ascending trend line, the risk of a break below it would mean a possible move lower first to $75.00 and then to $68.15, which would represent a decline of 3% and 10 %, respectively. This would materialize as traders get used to the risk exposure in the Middle East.
To the upside, the line in the sand remains at $79.73 with the 200-day SMA. Once above that level, the double layer appears with the 100-day SMA and the red descending trend line at $78.23. In case of an upward extension above that zone, the path is open again towards $87.12.
To the downside, the pivotal level at $75.28 is the last solid line in the sand that could end this decline. If this level does not hold, investors could expect accelerated selling towards $72.00 and $70.00. This would wipe out all gains by 2024 and then the oil price could test $68, the December 13 low.
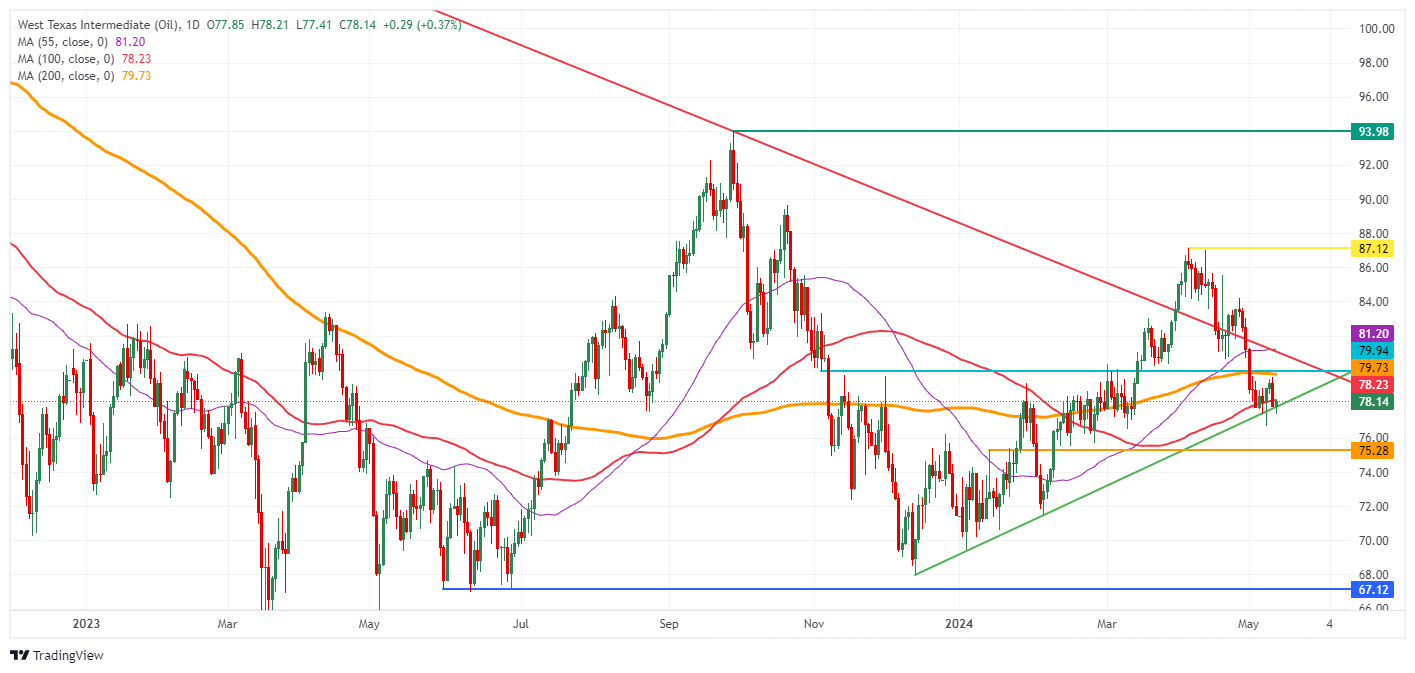
WTI Crude Oil: Daily Chart
WTI Oil FAQ
WTI oil is a type of crude oil that is sold in international markets. The acronym WTI stands for West Texas Intermediate, one of the three main types, including Brent and Dubai crude. WTI is also known as “light” and “sweet” for its relatively low gravity and sulfur content, respectively. It is considered a high-quality oil that is easily refined. It is sourced in the United States and distributed through the Cushing facility, considered “the pipeline junction of the world.” It is a benchmark for the oil market and the WTI price is frequently cited in the media.
As with all assets, supply and demand are the main drivers of the price of WTI oil. As such, global growth can be a driver of increased demand and vice versa in the case of weak global growth. Political instability, wars and sanctions can alter supply and impact prices. The decisions of OPEC, a group of the main oil-producing countries, is another key price factor. The value of the US Dollar influences the price of WTI crude oil, as oil is primarily traded in US dollars, so a weaker US Dollar can make oil more affordable and vice versa.
Weekly oil inventory reports published by the American Petroleum Institute (API) and the Energy Information Agency (EIA) influence the price of WTI oil. Changes in inventories reflect the fluctuation of supply and demand. If the data shows a decline in inventories, it may indicate an increase in demand, which would drive up the price of oil. An increase in inventories can reflect an increase in supply, which drives down prices. The API report is published every Tuesday, and the EIA one a day later. Their results are usually similar, with a difference between them of 1% 75% of the time. EIA data is considered more reliable since it is a government agency.
OPEC (Organization of the Petroleum Exporting Countries) is a group of 13 oil-producing nations that collectively decide member countries' production quotas at biannual meetings. Their decisions often influence WTI oil prices. When OPEC decides to reduce quotas, it can restrict supply and drive up oil prices. When OPEC increases production, the opposite effect occurs. OPEC+ is an expanded group that includes ten other non-OPEC member countries, including Russia.
Source: Fx Street
I am Joshua Winder, a senior-level journalist and editor at World Stock Market. I specialize in covering news related to the stock market and economic trends. With more than 8 years of experience in this field, I have become an expert in financial reporting.


