
- Oil prices are trading lower again after breaking a four-day winning streak on Tuesday.
- Traders saw a significant draw of 5.2 million barrels overnight from the American Petroleum Institute.
- US Dollar Index weakens ahead of US CPI release
Oil is lower as selling pressure is visible on the chart with further declines possible in crude oil prices after price action suffered a firm rejection at the 100-day simple moving average (SMA) at $78.50. The significant draw of 5.2 million barrels reported by the American Petroleum Institute (API) was able to offset some of Tuesday’s selling pressure, though not enough to sustain it. The initial selling took place following the release of the Producer Price Index (PPI), which was substantially softer than markets had expected, raising expectations for another soft reading for the US Consumer Price Index (CPI) later today.
The US Dollar Index (DXY), which tracks the performance of the US Dollar against six major currencies, is also facing selling pressure. The US CPI release for July is likely the most important data release of the week. Analysts expect the disinflationary path to continue, and this scenario could bring further weakness for the US Dollar (USD).
At the time of writing, WTI crude oil is trading at $77.02 and Brent Crude at $80.38.
Oil News and Market Factors: Short-Term vs. Long-Term
- Three Amframax tankers have been diverted from the port of Rotterdam after waiting for almost two weeks. According to Bloomberg data, the tankers have apparently not arrived at the port.
- The overnight change in U.S. crude stocks reported by the American Petroleum Institute (API) showed a significant draw of 5.2 million barrels. This is more than double the 2 million barrel draw expected by analysts.
- The Energy Information Administration (EIA) will release its stock change data at 14:30 GMT. Analysts expect to see a much smaller draw of 2 million barrels compared to the 3.728 million barrel draw the previous week.
- Bloomberg reported that the US has allowed the sale of missiles to Saudi Arabia, another escalating step in the Middle East region.
- Meanwhile, Iran’s retaliation against Israel is not taking place, creating a moment of easing tensions in the Gaza region as the main parties try to restart ceasefire talks.
Oil Technical Analysis: Here it gets tough
Oil prices have been soaring since Monday. The fact that both OPEC and the IEA are seeing a substantial supply surplus has led traders to double down on OPEC production changes, moving away from their commitment to ease output curbs. The risk to that could be large U.S. cut numbers, leading to very short-lived rallies. Still, the overall trend appears to be down.
On the upside, the trifecta of moving averages are the key levels to watch. First up is the 200-day simple moving average (SMA) at $77.68. From there, the 55-day SMA comes into focus at $78.50. The last comes in at $79.78, just shy of $80.00, with the 100-day SMA all residing in a very tight range.
On the downside, a bigger move could develop. The first support comes in at $75.27, but that has been cut in July and August, so it might have lost relevance. The August low at $71.17 is the best level for a bounce.
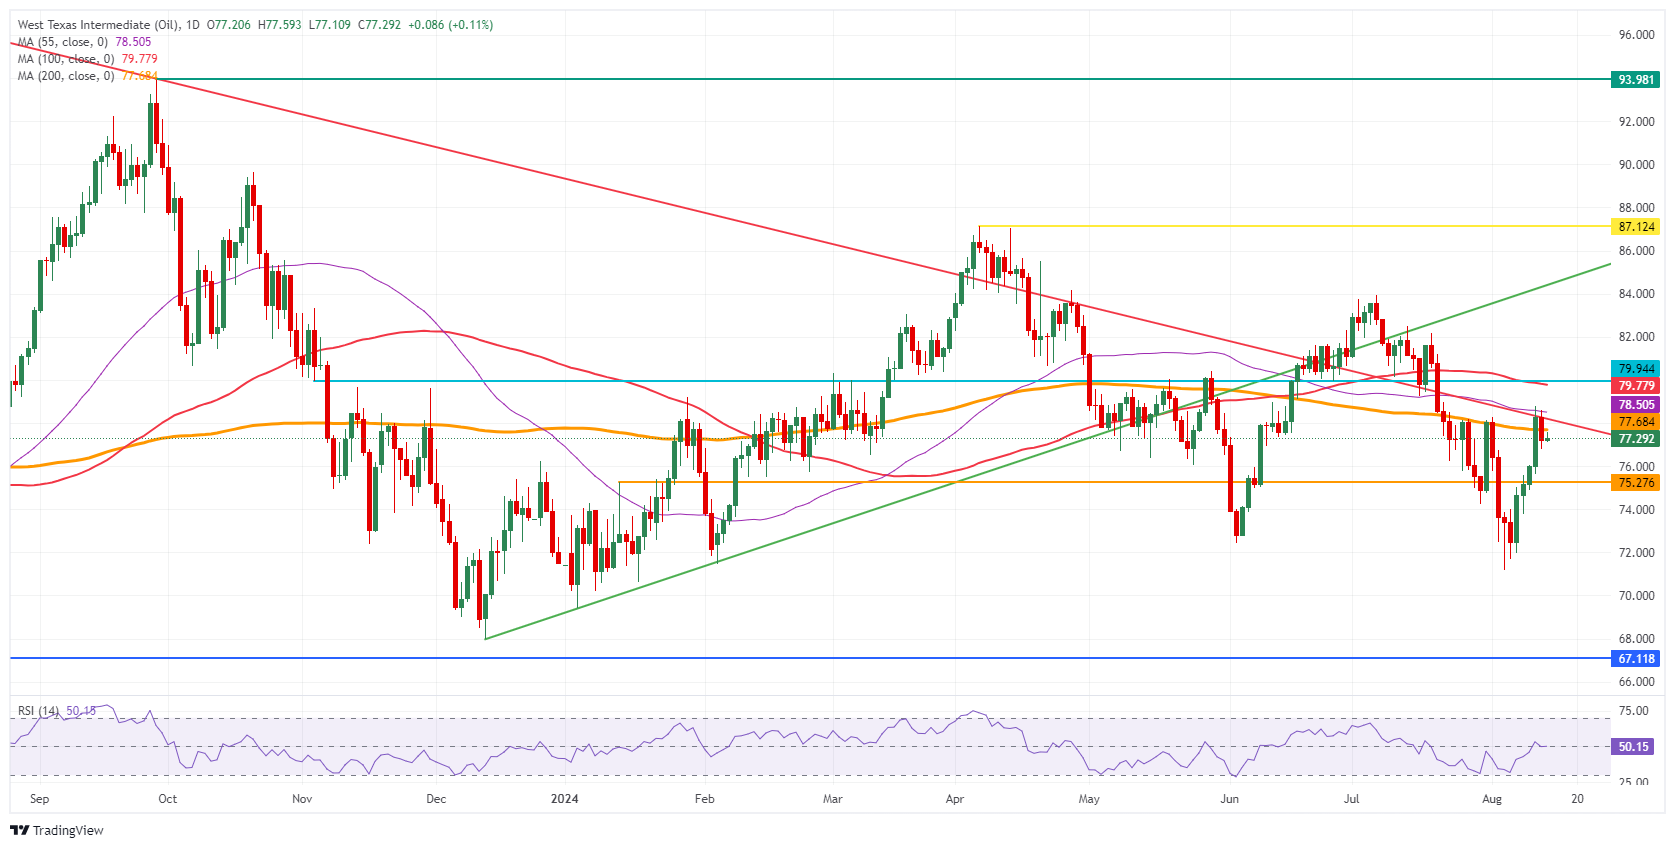
WTI Crude Oil Daily Chart
WTI Oil FAQs
WTI crude oil is a type of crude oil sold on international markets. WTI stands for West Texas Intermediate, one of three main types that include Brent and Dubai crude. WTI is also known as “light” and “sweet” for its relatively low gravity and sulfur content, respectively. It is considered a high-quality oil that is easily refined. It is sourced in the United States and distributed through the Cushing hub, considered “the pipeline crossroads of the world.” It is a benchmark for the oil market and the price of WTI is frequently quoted in the media.
Like all assets, supply and demand are the main factors determining the price of WTI crude oil. As such, global growth can be a driver of increased demand and vice versa in the case of weak global growth. Political instability, wars and sanctions can disrupt supply and impact prices. Decisions by OPEC, a group of large oil producing countries, are another key driver of price. The value of the US Dollar influences the price of WTI crude oil, as oil is primarily traded in US Dollars, so a weaker Dollar can make oil more affordable and vice versa.
The weekly oil inventory reports published by the American Petroleum Institute (API) and the Energy Information Agency (EIA) influence the price of WTI oil. Changes in inventories reflect fluctuations in supply and demand. If the data show a decrease in inventories, it may indicate an increase in demand, which would push up the price of oil. An increase in inventories may reflect an increase in supply, which pushes down prices. The API report is published every Tuesday, and the EIA report the following day. Their results are usually similar, with a difference of 1% between them 75% of the time. The EIA data is considered more reliable because it is a government agency.
OPEC (Organization of the Petroleum Exporting Countries) is a group of 13 oil-producing nations that collectively decide on member countries’ production quotas at biennial meetings. Their decisions often influence WTI oil prices. When OPEC decides to reduce quotas, it can restrict supply and drive up oil prices. When OPEC increases production, the opposite effect occurs. OPEC+ is an expanded group that includes ten other non-OPEC countries, most notably Russia.
Source: Fx Street
I am Joshua Winder, a senior-level journalist and editor at World Stock Market. I specialize in covering news related to the stock market and economic trends. With more than 8 years of experience in this field, I have become an expert in financial reporting.


