
- WTI price remains vulnerable amid fears of an inevitable global recession.
- Concerns about the China shutdown will make any rebound in oil short-lived.
- The impending bearish cross is keeping sellers hopeful, with their eyes on the 200 moving average.
WTI (NYMEX Futures) is hovering around $99, after the bounce hit resistance above $100 earlier in the Asian session. The price consolidates the sharp drop of 9.5% that occurred on Tuesdayas bears gather strength for the next downside push.
Fears of a global recession increased as liquidity returned after a three-day US holiday, hitting higher-yielding assets such as oil. Rampant inflation, rising energy prices and central banks’ move to raise interest rates intensified fears of an economic slowdown.
Despite concerns about growth in demand for oil and its products, black gold continued to rise on the wave of risk aversion. Right now, a small rally in European stock markets is giving US oil a respite. Despite the rebound, the downward trend remains more pronounced, as new restrictions loom in the Chinese city of Shanghai.
Aside from discouraging fundamentals, WTI’s daily technical setup also points to further downside. The 21-day moving average is set to cut the 50-day from above, which if it occurs will confirm a bearish cross. Black gold could experience a further decline to retest two-month lows near $95.75. A break below the latter will expose the rising 200-day moving average at $92.51.
WTI: Daily Chart
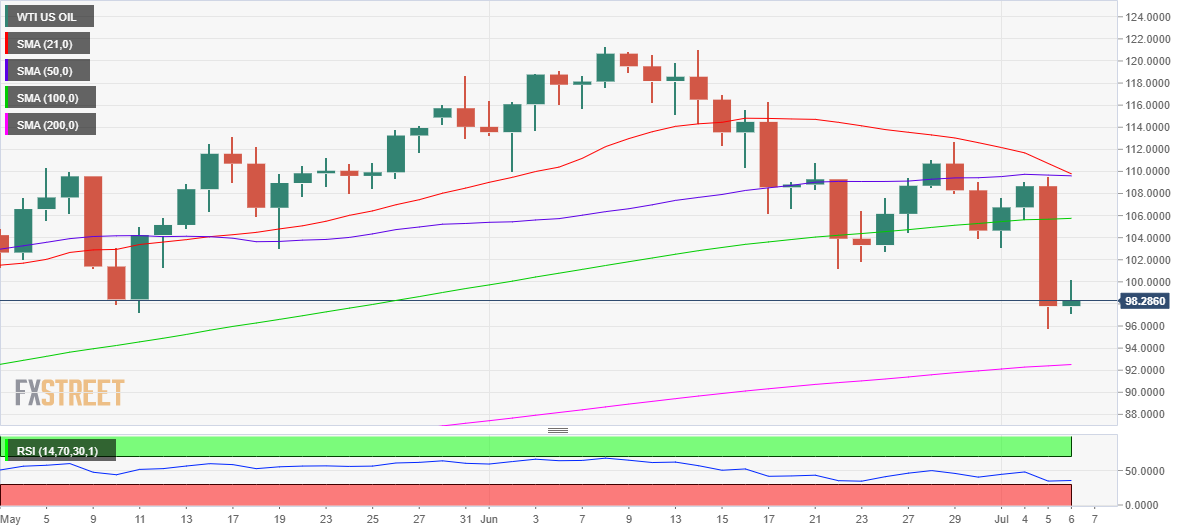
The 14-day Relative Strength Index (RSI) has flattened just above the oversold zone, and continues to lurk in the negative zone. This suggests that any oil price recovery is likely to remain short-lived.
On the other hand, acceptance above $100 is critical to initiate any meaningful recovery towards the flat $100 SMA at $105.75. Further up the gates will reopen for a $110 ride.
WTI: Additional Levels
Source: Fx Street
With 6 years of experience, I bring to the table captivating and informative writing in the world news category. My expertise covers a range of industries, including tourism, technology, forex and stocks. From brief social media posts to in-depth articles, I am dedicated to creating compelling content for various platforms.


