What is MVRV
MVRV is an indicator that stands for Market Value to Realized Value, which translates as market value to sales value. The indicator was first described in October 2018 by Murad Mahmudov and David Puell.
MVRV shows how much the current price differs from the average purchase price of the cryptocurrency. The higher the indicator, the more investors are in profit, and if so, the closer the asset is to overbought, which in turn may indicate imminent sales.
Essentially, MVRV is an oscillator. It is calculated as the ratio of market value (MV) to the realized value (RV):
MVRV= MV/RV
What is MV
MV is a synonym for the market capitalization of a cryptocurrency. In other words, it is the product of the total number of tokens in free circulation and the current market price.
It is worth noting that Bitcoin’s MV is constantly changing. This is not only due to price fluctuations, but also because the supply of BTC continues to increase.
What is RV
RV is an indicator of the price at which a particular token was sold at the moment of its last movement (purchase). For example, an investor bought Bitcoin at $40,000 and continues to hold it. His RV in this case is $40,000, since he did nothing with his BTC.
Practical application of MVRV
First, let’s figure out what values the indicator can take. Obviously, MVRV will always be greater than or equal to 0, because the price cannot be negative, and therefore, neither can market capitalization.
What does this give? There are three situations:
-
MVRV ranges from 0 to 1;
-
MVRV is greater than 1 but less than 2;
-
MVRV greater than 2.
In the first case, there is a clear “undervaluation” on the market, that is, a situation where the majority of hodlers are in the red.
The second case is a kind of intermediate and most common variant. Here, some token holders are in the black, others are in the red.
The third case is an example of an overbought market, where all holders can lock in at least a two-fold profit.
Someone might ask: “But MVRV will also take into account wallets that have long been lost. It is not a real reflection of the situation. Is it?”
In general, everything is correct. MVRV in its classical representation reflects the latest movements of all tokens that have appeared. But some platforms have figured out how to get around this problem.
To make the picture more relevant, some platforms offer to enable time binding. In short, you can set the moment of the last token movement yourself. For example, you can set for accounting only those coins that were in movement over the last 12 months, six months, a quarter or even a day. It is clear that in this case, the interpretation of the resulting data will be somewhat different.
BTC MVRV 2024
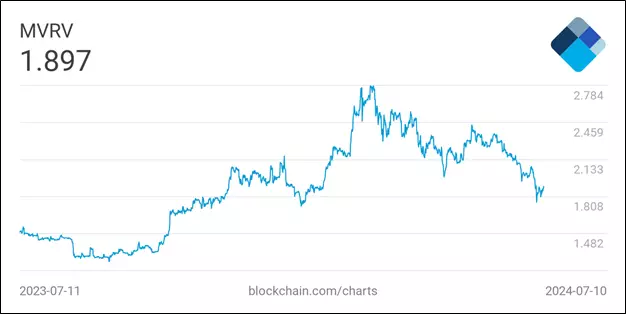
As of July 8, 2024, Bitcoin’s MVRV is 1.854. This suggests that most of the BTC purchased is in profit. The year-over-year high was reached in March 2024 at 2.758. This coincides exactly with the day Bitcoin reached its current all-time high of $73,794.

Source: blockchain.com
MVRV Z-SCORE
In addition to the classic MVRV, you can also find the MVRV Z-Score. The MVRV Z-Score is a modification of what the regular MVRV is. It shows how much Bitcoin is over- or undervalued relative to its normal value. The MVRV Z-Score is calculated using the following formula:
MVRV Z-Score = (MV – RB)/ Standard deviation (MV).
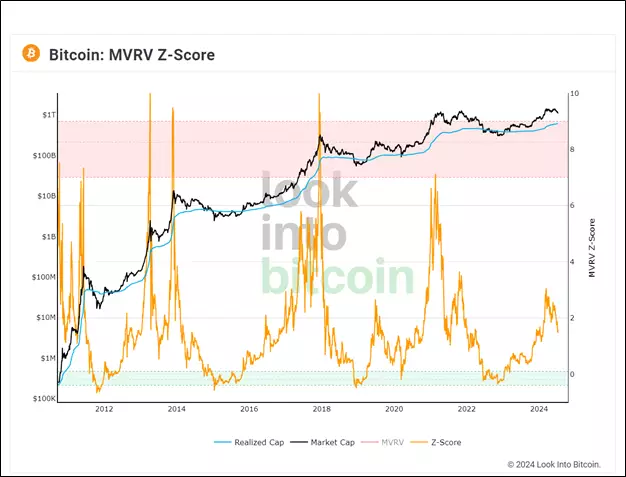
As can be seen from the formula, the indicator is obtained by dividing the difference between MV and RV by the standard deviation of MV. Unlike the classic MVRV, the MVRV Z-Score can be negative.

Source: lookintobitcoin.com
The interpretation of MVRV Z-Score is as follows: if the indicator is above 7, then Bitcoin is overbought, and if below zero, then it is oversold. In both cases, a reversal should be expected: in the first case, downwards, in the second, upwards.
Both MVRV and MVRV Z-Score cannot be used as an exclusive tool for predicting the price and entering or exiting a trade. The market situation should be assessed comprehensively, focusing not only on indicators. MVRV and MVRV Z-Score only show the overall picture, which is useful for understanding the situation.
Conclusion
MVRV is an oscillator that shows how many times the current market capitalization exceeds the realized value. The indicator has a number of related tools, one of which is MVRV Z-Score. You should not use MVRV alone for trading, as it does not provide accurate data on buying and selling, but only shows general market trends.
Source: Bits
I am an experienced journalist, writer, and editor with a passion for finance and business news. I have been working in the journalism field for over 6 years, covering a variety of topics from finance to technology. As an author at World Stock Market, I specialize in finance business-related topics.


