What is Stock-to-Flow
The Stock-to-Flow (SF) model is based on the ratio of the amount of cryptocurrency (or any other commodity) in circulation to the level of its production. SF is intended to show how much time is needed to release the current supply of Bitcoin.
Interestingly, the concept of SF is a measure of the rarity of a crypto asset. At the same time, rarity is not understood in the everyday sense of the word, as something that is difficult to obtain. It is based on the definition of cryptographer Nick Szabo, who views rarity as “genuine pricelessness.” In other words, the implication is that the creation of each unit of a commodity, be it gold or Bitcoin, is priceless in itself.
How to calculate Stock-to-Flow
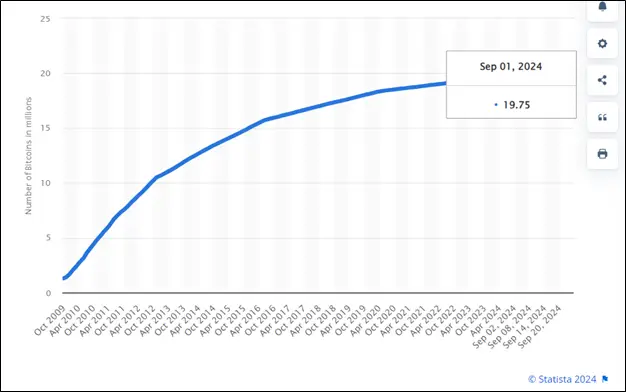
For example, on September 1, 2024, the number of BTC in circulation was 19.75 million, and on September 1, 2023, it was 19.28 million. Thus, 0.47 million BTC were produced during the year.

Source: statista.com
As a result, we can calculate SF:
SF = 19,750,000/470,000 = 42
It turns out that at current production levels it will take 42 years to reach modern supply. What does this give? The fact that based on Stock-to-Flow you can calculate the possible cost of Bitcoin.
Price calculation
Among other things, SF is a power law function. Initially it looked like this:
BTC price = 0.4*SF3
However, after 2019, the model calculation was revised upward. The new formula looks like this:
BTC price = 0.18*SF3.3
It is worth noting that when calculating Stock-to-Flow, various resources often use data not for the year, but for other periods. Let’s look at where you can see with your own eyes the Bitcoin price forecast based on this model.
Where to look for Stock-to-Flow
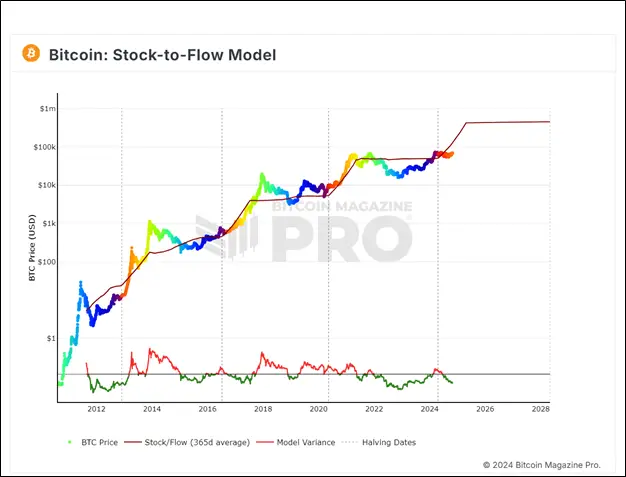
Quite a lot of resources provide information on the Stock-to-Flow model. For example, Bitcoimagazinepro provides data on average for the year, specifying the number of days until the next halving.

Source: bitcoinmagazinepro.com
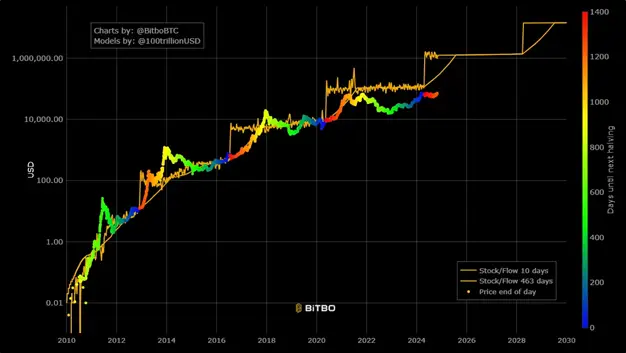
The bitbo.io resource provides information on SF for 10 and 463 days. In this case, for the first indicator, the amount of bitcoin produced over the last 10 days is taken, then it is divided by ten and multiplied by 365. Thus, a kind of calculation of output is simply obtained. The second number, 463, comes from a study conducted by investor and YouTuber Preston Pysh. According to him, Bitcoin cycles occur approximately every 200,000 blocks in three phases: bullish, corrective, and mean reversion. Considering that there are about 144 blocks per day, we get:
200,000 /3/144 = 463.

Source: charts.bitbo.io
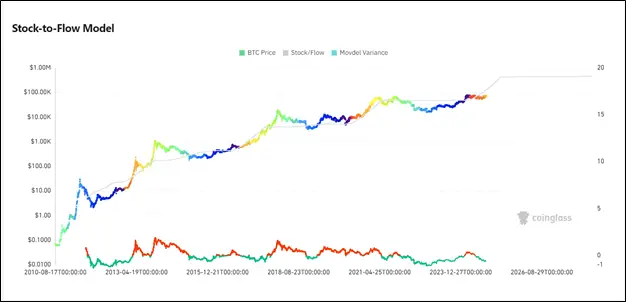
Coinglass also has its own option. It is more classic and similar to what Bitcoimagazinepro offers.

Source: coinglass.com
If you look closely, you can see lines at the bottom of the chart – this is another indicator called Stock-to-Flow Deflection.
Stock-to-Flow Deflection
Stock-to-Flow Deflection shows the discrepancy between the real price of Bitcoin and the model calculated. The interpretation is as follows: if the indicator is greater than one, then BTC is overbought and we can expect a quick fall; if it is less, then it is oversold, which portends a bullish rally.
Who created Stock-to-Flow
For the first time the model was proposed March 22, 2019 in the article “Modeling the value of Bitcoin taking into account its rarity.” Its author was an anonymous user under the pseudonym Plan B. another article of mine “A Valid Market Hypothesis and Stock-to-Flow Model in Bitcoin” January 17, 2022 Plan B says he has over 20 years of experience as an institutional investor overseeing multi-billion dollar euro accounts. Similar information can be found on Plan B’s YouTube account.
Conclusion
Thus, the Stock-to-Flow model is another attempt to use mathematics to find out the future price of Bitcoin. Its author remains incognito, only his pseudonym is known – Plan B. The model does not completely replicate the price of Bitcoin, and the resulting discrepancy also has an indicator – Stock-to-Flow Deflection.
This material and the information contained herein do not constitute individual or other investment advice. The opinion of the editors may not coincide with the opinions of analytical portals and experts.
Source: Bits
I am an experienced journalist, writer, and editor with a passion for finance and business news. I have been working in the journalism field for over 6 years, covering a variety of topics from finance to technology. As an author at World Stock Market, I specialize in finance business-related topics.


