Bitcoin
Bitcoin from August 15 to 22, 2025 lost 3.66%. Last week, BTC could not update the historical maximum, dropping below $ 115,000. At the same time, the volatility remained relatively low: the price change never exceeded 3%per day.
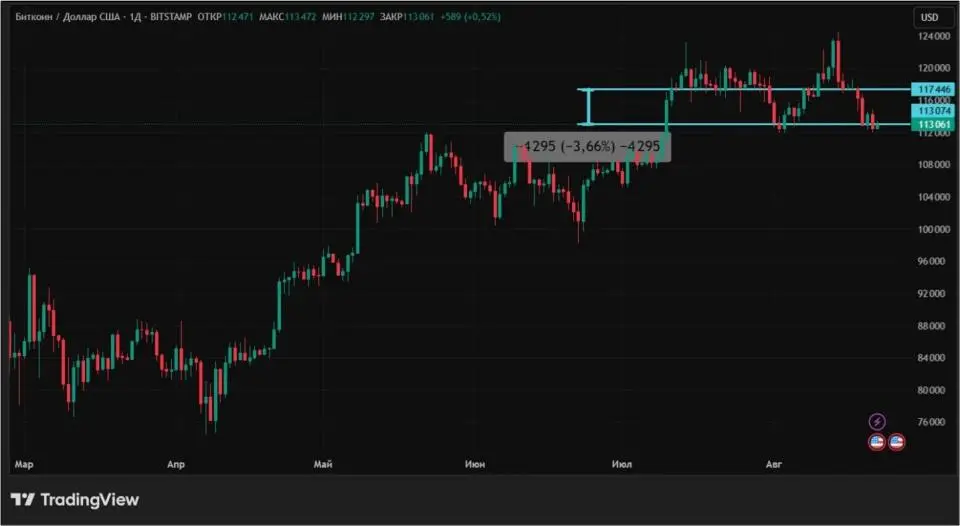
Source: TradingView.com
The main reason for the fall in the cost of bitcoin is the fears of investors about the performance of the head of the Fed Jerome Powell, which is scheduled for Friday, August 22. Investors are awaiting new information about the reduction of the key rate at the next meeting in September. Given that inflation data for July were rather negative due to the growth of the base indicator by 0.2%, investors
Fear The next round of the “Powell Rhetoric Hawks”, which is bad for the price of the first cryptocurrency.
The Polymarket forecast portal is the most likely considered to reduce the key rate of the American Central Bank by 0.25%. Chances are estimated at 59%.
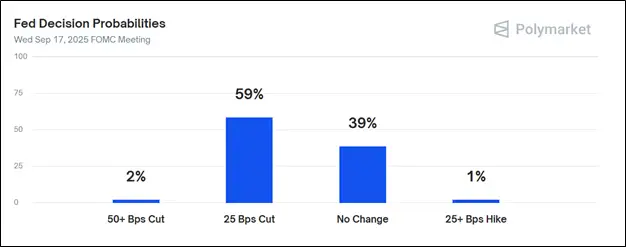
Source: Polymarket.com
In addition, the behavior of short -term holders continues to influence the price of Bitcoin. At the beginning of the week, for two days, 50,026 BTC ($ 5.69 billion) were received at the crypto -tanks. Most of the sellers sold cryptocurrency with a loss,
She shared Cryptoquant analytical platform.
The spotal ETF on bitcoin has a negative dynamics. All trading sessions of exchange funds recorded the outflow of funds. In total, it amounted to $ 1.15 billion in a week. For almost six months, such a large week of money was not recorded. The last time the larger withdrawal of funds – $ 2.61 billion – happened in the last days of February 2025.
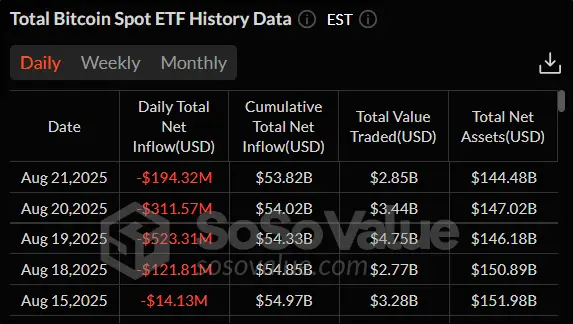
Source: sosovalue.com
From the point of view of technical analysis, the trend of Bitcoin is descending. The price of the BTC dropped below the 50-day sliding average (indicated in blue). RSI confirms bear trends, continuing to fall. The indicator has already dropped below the value of 50. The nearest levels of support and resistance to daily graphics: 112 000 and 124 517, respectively.
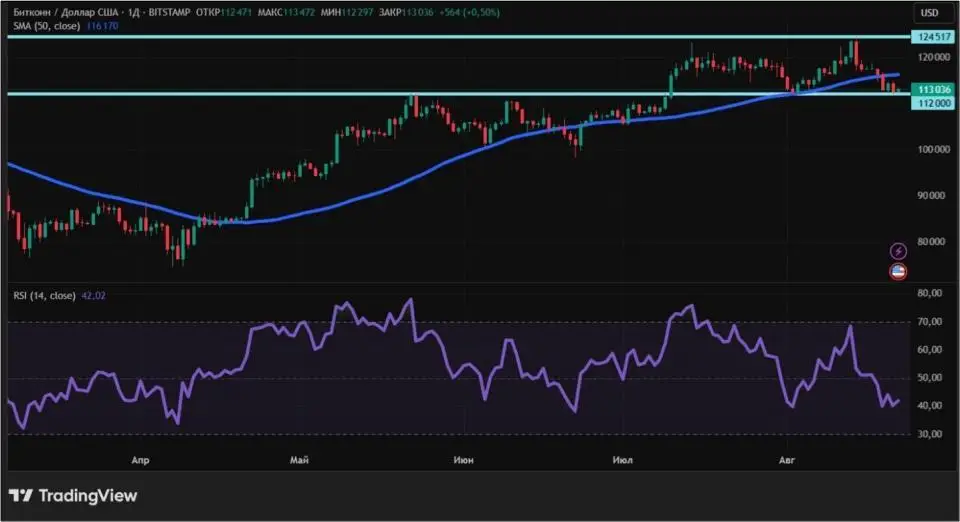
Source: TradingView.com
Index
Fear and greed Decreased by ten points compared to last week. The current value is 50. This suggests that neutrality has been established in the mood of the crypto -investors.
Ethereum
The ether, like Bitcoin, in a week from August 15 to 22, fell by more than 3.5%. The second in capitalization of cryptocurrency has not yet been able to update the historical maximum. Nevertheless, ETH continues to bargain above the psychologically important mark of $ 4000.
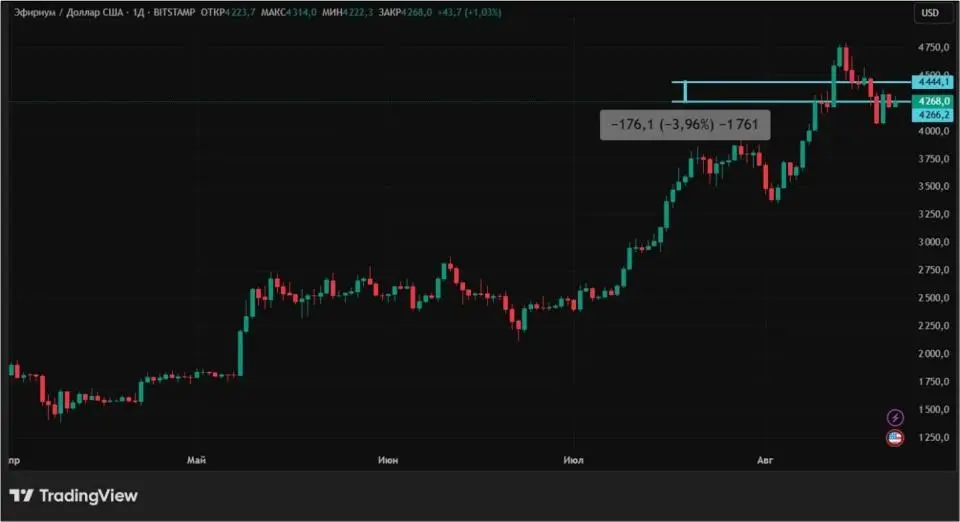
Source: TradingView.com
The continuation of a decrease in the ether, as well as Bitcoin, is explained, including with careful expectations from Jerome Powell’s performance. But there were other important negative factors. In the week, a significant number of liquidations (forced closure) of the Long (for the purchase) of positions were observed – by $ 507.25 million. This is 1.7 times more than short liquidations.

Source: Coinglass.com
For spotes ETF on the air, a cash outflow of money in the amount of more than $ 0.5 billion is recorded on the week. Thus, a series of continuous receipt of money to exchange funds is interrupted in the 14th week. The last time the outflow of cash from spotes ETF on ETH was recorded in early May.
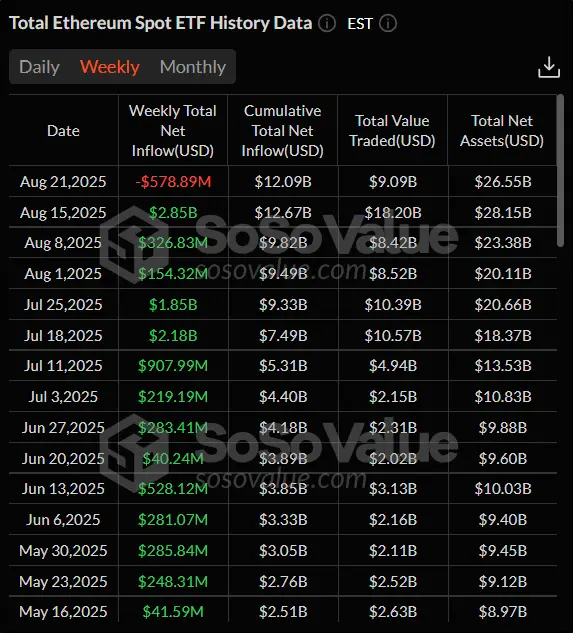
Source: sosovalue.com
And the potential reason for reducing the ether could be a slight growth of the ETH reserve in crypto -streaks. Although there is no reason for panic yet, investors showed noticeable caution,
informed Cryptoquant analytical platform.
From the point of view of technical analysis, despite the decline in cost, the ether remains in the ascending trend. The price remains higher than a 50-day sliding average (indicated in blue). The strength of the trend was somewhat weakened. This is evidenced by a small decrease in the ADX indicator. The nearest levels of support and resistance to daily graphics: $ 4791.5 and $ 3940.5, respectively.
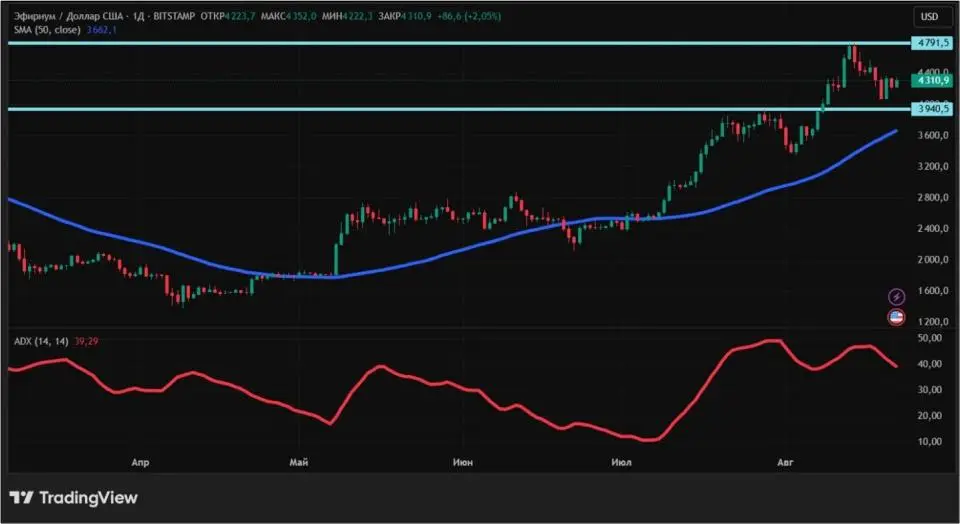
Source: TradingView.com
Chainlink
The cost of Chainlink cryptocurrency from August 15 to 22 increased by 12.77%. The week was marked by serious fluctuations. Twice, August 17 and 20, Link valued by more than 10% for one trading session. Having reached $ 26.88 in the week, Chainlink has updated its maximum in seven months.
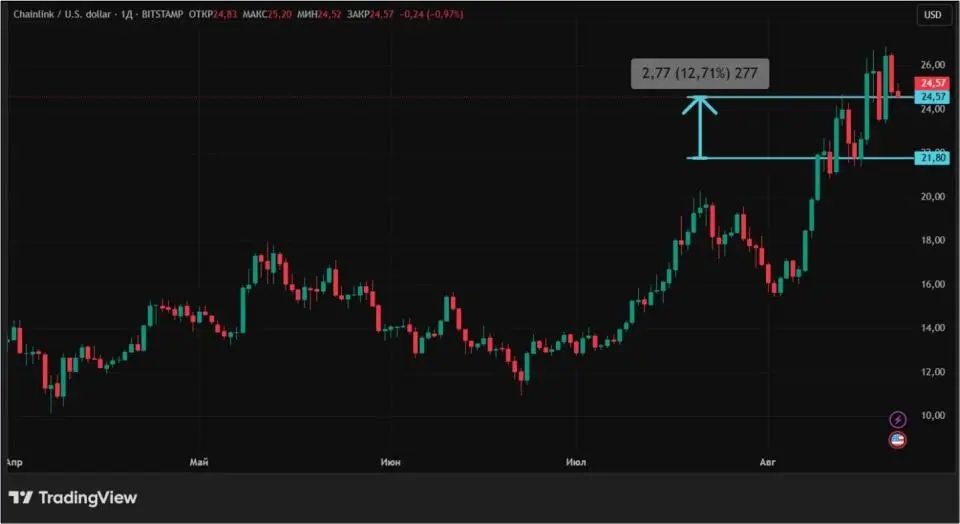
Source: TradingView.com
The increase in the cost of Link is associated with several reasons. One of them is the growth of network indicators. Analytical platform Santiment
notedthat on August 18, 9,813 addresses held at least one transaction. This is the best indicator for active users in the day in 2025. Another record was recorded on Monday, April 19. For this day, 9,625 new addresses were created – also the best indicator of the year.
Santiment noted the successes of Chainlink in the field of developers in the market of tokenized assets of the real world (RWA). According to the platform, this cryptocurrency took first place over the past month among all with 237.93 events (key changes in separate files) on the GitHub portal. She went around projects such as Avalanche and Stellar, who took second and third places, respectively.
Another CHAINLINK rise catalyst is the activity of large players (whales). Lookonchain analytical platform
Fixed The withdrawal by one user from the Binance exchange 1,293,757 Link in the amount of $ 31.15 million. Four days were withdrawn. Another site engaged in cryptoanalysts, Nansen
She saidthat the largest 100 wallets increased their accumulations of Chainlink by 12% in recent days. Statistics say that investors prefer not to trade Link, but to hold, as they expect further growth.
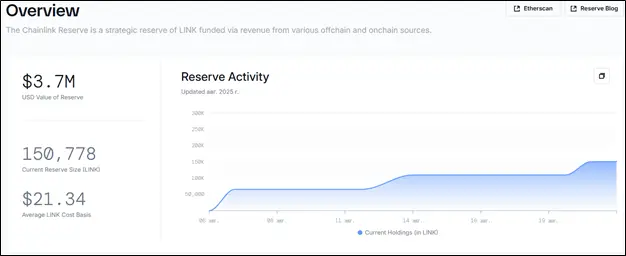
Here it is worth mentioning the next increase in the ChainLink reserve. After the last acquisition on August 20, it reached 150 778 Link (about $ 3.7 million), increasing in size compared to last week by 37.5%.
Source: Metrics.Chain.Link
CHAINLINK trade activity is observed not only in the spot market, but also in the derivatives market. An indicator of open interest in cryptocurrency futures last week for the first time exceeded $ 1.5 billion. At the peak, it reached $ 1.81 billion. Since the beginning of the year, an open interest in Chainlink has grown more than three times, which indicates a growing interest in instruments for this digital asset from the crypto -performance.

Source: Coinglass.com
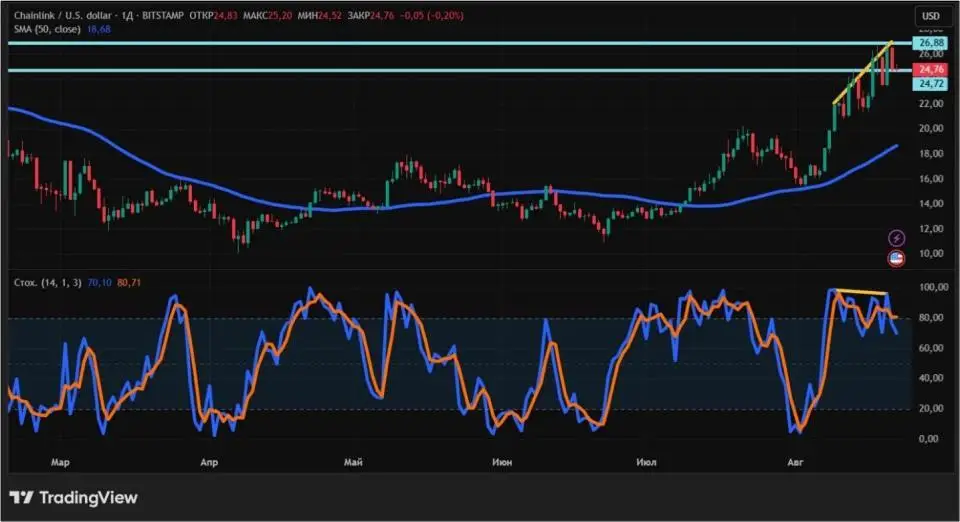
From the point of view of technical analysis, Chainlink remains in an upward trend. This is evidenced by the location of the price above a 50-day sliding average (indicated in blue). But indicators serve alarming signs. For example, Stochastik not only came out of the overlaps zone, but also formed a bear divergence (marked with yellow lines) – a situation where the price showed a new maximum, and the value of the oscillator is not. Both of these signals usually portend the correction, and therefore traders need to be careful about transactions with caution. The nearest levels of support and resistance on the daily schedule: $ 24.72 and $ 26.88, respectively.
Source: TradingView.com
Conclusion
Bitcoin and ether decreased in the price of last week, including due to fears about changes in the rate on loans in the United States. Chainlink, on the contrary, was able to rise in price, despite the negative. The strong indicators of the network, the leadership in RWA developments and the historical maximum of the open interest in this cryptocurrency helped.
This material and information in it is not an individual or other other investment recommendation. The view of the editorial office may not coincide with the opinions of analytical portals and experts.
Source: Bits
I am an experienced journalist, writer, and editor with a passion for finance and business news. I have been working in the journalism field for over 6 years, covering a variety of topics from finance to technology. As an author at World Stock Market, I specialize in finance business-related topics.


