
- Rent the Runway shares rose more than 160% after updating its 2024 outlook.
- Officials expect the company to post positive free cash flow this year.
- The PPI challenges Wednesday's CPI with mixed data on producer price inflation.
- RENT shares hit seven-month highs, but fail to cover the gap.
The actions of Rent the Runway (RENT) closed up 161.9% on Thursday to $19.38 after the ill-fated e-commerce company renewed market interest with the announcement that it should reach positive free cash flow in 2024. RENT shares hit an intraday high of $24.12 an hour into the session and traded below $17 before resuming the rally towards the end of the session. At the last minute, RENT once again surpassed $20 per share.
The market in general fell in the morning session, but rose strongly in the afternoon after the Production Price Index (PPI) was released on Thursday, which showed a decrease in general inflation although not in core inflation.
The Nasdaq has been the one that has responded best to the IPP news and has risen 1.7%, recovering part of Wednesday's sales. The S&P 500 gained 0.7%, while the Dow Jones closed just in the red.
Rent the Runway News
Rent the Runway, a company that rents designer clothing to an army of subscribers, posted another exorbitant loss for the fiscal fourth quarter of 2023, it reported late Wednesday. However, the market chose to focus instead on the pleasing rise in the fiscal outlook for 2024.
“Over the last few years, we have significantly reduced fixed costs and made considerable progress in building a more capital-light model,” said CFO Sid Thacker, “We expect these actions to result in a break-even point in cash flow.” of free cash for fiscal year 2024″.
In fiscal 2024, CEO Jennifer Hyman expects revenue to increase to $312.5 million from $298.2 million in the previous fiscal year.
In the reference quarter, which ended January 31, Rent the Runway recorded little annual user growth. Active subscribers fell 1% to just below 126,000, while total subscribers rose 1% to over 173,000.
In the fiscal fourth quarter, Rent the Runway posted a loss of $7.02 per share in GAAP earnings, better than the $8.07 loss a year earlier. However, this figure is still below Wall Street estimates by $1.13. Revenue of $75.8 million rose 0.5% year over year, but beat analysts' expectations by $1.4 million.
CEO Hyman praised the company for implementing a series of cost-saving strategies that she said will continue to pay off in the coming quarters.
Rent the Runway Stock Forecast
Rent the Runway just did a 1-for-20 reverse stock split at the beginning of the month. That's how much the market was betting on its prospects.
Now it looks like RENT stock has hope. The stock is valued at just $76 million in total market capitalization, so just trading at once annual revenue could mean a 300% return.
RENT stock has pivoted above its fateful drop on September 8 of last year. The gap created since the previous session has a low of $25.20, and that is where the market bulls will try to push it. Traders love to close gaps.
It's quite difficult to know where support is after a spike like this, but the best guess is the area around $17. That's where RENT stock encountered resistance in mid-December 2023.
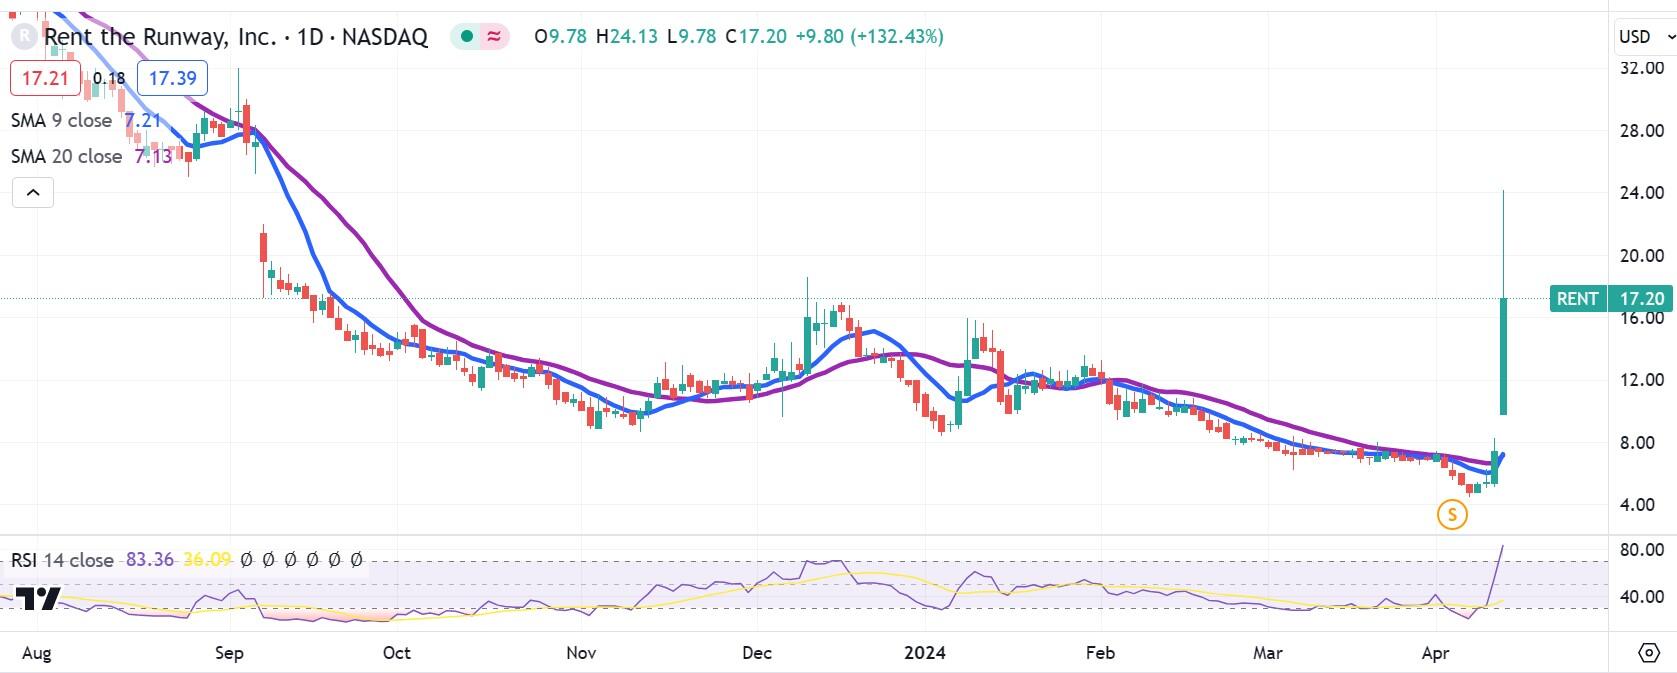
RENT daily chart
Nasdaq FAQ
What is Nasdaq?
Nasdaq is an American stock exchange that began as an electronic stock ticker. At first, the Nasdaq only offered over-the-counter (OTC) stock listings, but it later became an exchange as well. By 1991, the Nasdaq had grown to represent 46% of the entire US stock market. In 1998, it became the first US exchange to offer online trading. The Nasdaq also produces several indices, the most comprehensive of which are the Nasdaq Composite, which represents the more than 2,500 Nasdaq securities, and the Nasdaq 100.
What is the Nasdaq 100?
The Nasdaq 100 is a large-cap index composed of 100 non-financial companies on the Nasdaq Stock Exchange. Although it only includes a fraction of the thousands of stocks on the Nasdaq, it explains more than 90% of the movement. The influence of each company in the index is weighted based on market capitalization. The Nasdaq 100 includes companies highly focused on technology, although it also includes companies from other sectors and from outside the United States. The Nasdaq 100's average annual return has been 17.23% since 1986.
How can I trade the Nasdaq 100?
There are several ways to trade the Nasdaq 100. Most retail brokers and spread betting platforms offer Contracts for Difference (CFD) betting. For long-term investors, exchange-traded funds (ETFs) operate like stocks that mimic the movement of the index without the investor having to buy all 100 companies that comprise it. An example of an ETF is the Invesco QQQ Trust (QQQ). Nasdaq 100 futures contracts allow you to speculate on the future performance of the index. Options provide the right, but not the obligation, to buy or sell the Nasdaq 100 at a specific price (strike price) in the future.
What factors drive the Nasdaq 100?
There are many factors that drive the Nasdaq 100, but primarily it is the aggregate performance of its component companies, revealed in their quarterly and annual earnings reports. US and global macroeconomic data also contribute, influencing investor sentiment, which if positive, drives earnings. The level of interest rates, set by the Federal Reserve (Fed), also influences the Nasdaq 100, as it affects the cost of credit, on which many companies largely depend. Therefore, the level of inflation can also be an important factor, as well as other parameters that influence the Federal Reserve's decisions.
Source: Fx Street
I am Joshua Winder, a senior-level journalist and editor at World Stock Market. I specialize in covering news related to the stock market and economic trends. With more than 8 years of experience in this field, I have become an expert in financial reporting.


