
- US traders are on holiday due to US Independence Day, so most assets are trading within known ranges.
- Silver price is subdued and remains negative, driven by depressed precious and base metal prices.
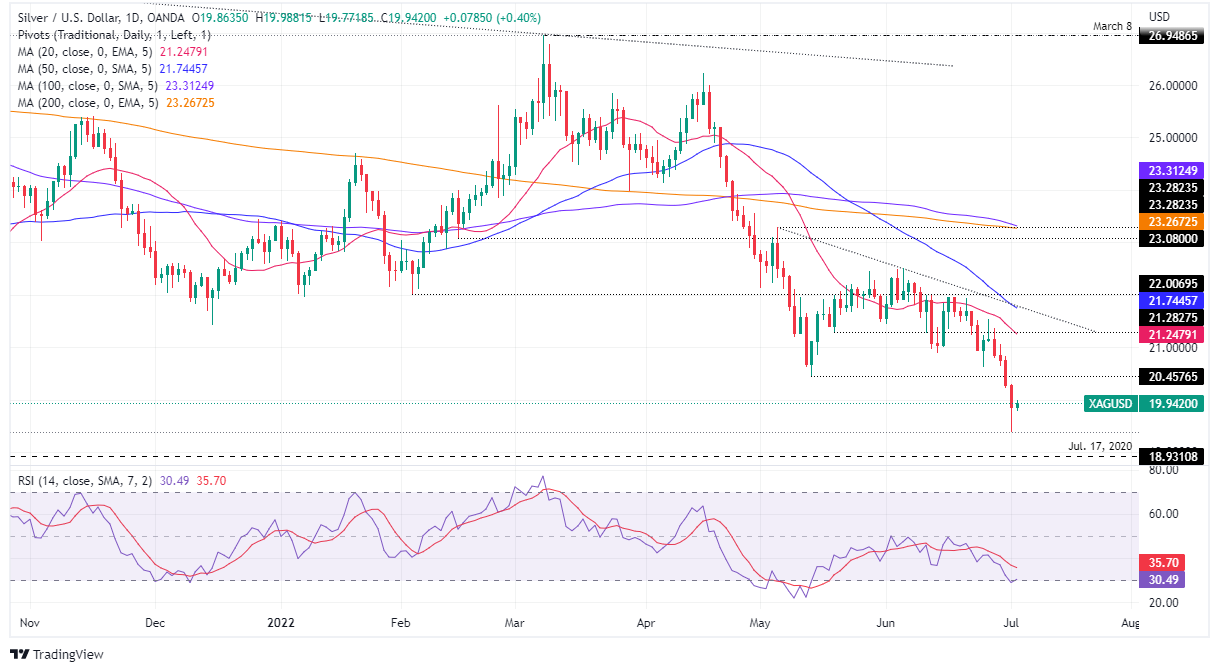
- Silver (XAGUSD) Price Forecast: Positive divergence on the daily chart could open the door for further gains as buyers target $20.45.
Silver (XAG/USD) is under pressure on Monday, in the midst of a illiquid trading session, in observance of US Independence Day. XAG/USD remains within a tight range of $19.82-$19.88 during the American session. At the time of writing, XAG/USD is trading at $19.95.
Silver price remains below $20.00, influenced by falling gold and base metals
Sentiment is mixed, as evidenced by equities rising, with the exception of the Dax 40, while haven mates fall across the currency space. The greenback is almost flat, while the US bond market remains close. That said, US Treasury yields remained flat while the price of silver fell last Friday to a fresh 2-year low around $19.38.
Despite this, XAG/USD formed a hammer last Friday, which means that the price of silver could head higher, and could retest the swing low of May 13 at $20.45. But first, silver buyers must push the price of the white metal above the July 1 high of $20.30.
Meanwhile, the dollar index, which measures the dollar’s performance against a basket of six rivals, is up just 0.06% at 105.186.
Commerzbank analysts wrote that the gold/silver ratio has risen to almost 90, which means that the price of XAG/USD is low compared to gold. They added that silver was being dragged down by falling gold prices and stated “it is being further depressed by very weak base metal prices – this is because silver is not just an investment metal but as much a also an industrial metal”.
In the week ahead, the US economic calendar on Wednesday will include the US Non-Manufacturing PMIs for June, the Fed Talk with New York Fed President John Williams, and the minutes from the last FOMC meeting.
Silver (XAGUSD) Price Forecast: Technical Outlook
The white metal continues to have a bearish bias. However, the magnitude of last week’s decline could be subject to a mean-reversion move, further consolidating the aforementioned oscillators showing positive divergence between price action and the Relative Strength Index (RSI). .
If the latter scenario occurs, the first resistance for XAGUSD would be $20.00. A break above would open the way to $20.30, followed by a challenge to the May 16 low of $20.45. Otherwise, a retest of the two-year low at $19.38 is anticipated.
Technical levels
Source: Fx Street
With 6 years of experience, I bring to the table captivating and informative writing in the world news category. My expertise covers a range of industries, including tourism, technology, forex and stocks. From brief social media posts to in-depth articles, I am dedicated to creating compelling content for various platforms.


