
- Silver is forming a symmetrical triangle, or bullish pennant continuation pattern with bullish implications for the price.
- It is also probably rising in the final wave C of a measured moving pattern, also with bullish expectations.
- The MACD is ready to rise further after crossing the zero line.
The Silver (XAG/USD) has formed a price pattern after its recent rally, which saw it break out of its descending channel.
The price pattern could be a symmetrical triangle, or perhaps a bullish pennant continuation pattern; the former has slightly bullish connotations, the latter has stronger bullish implications.
Silver Daily Chart
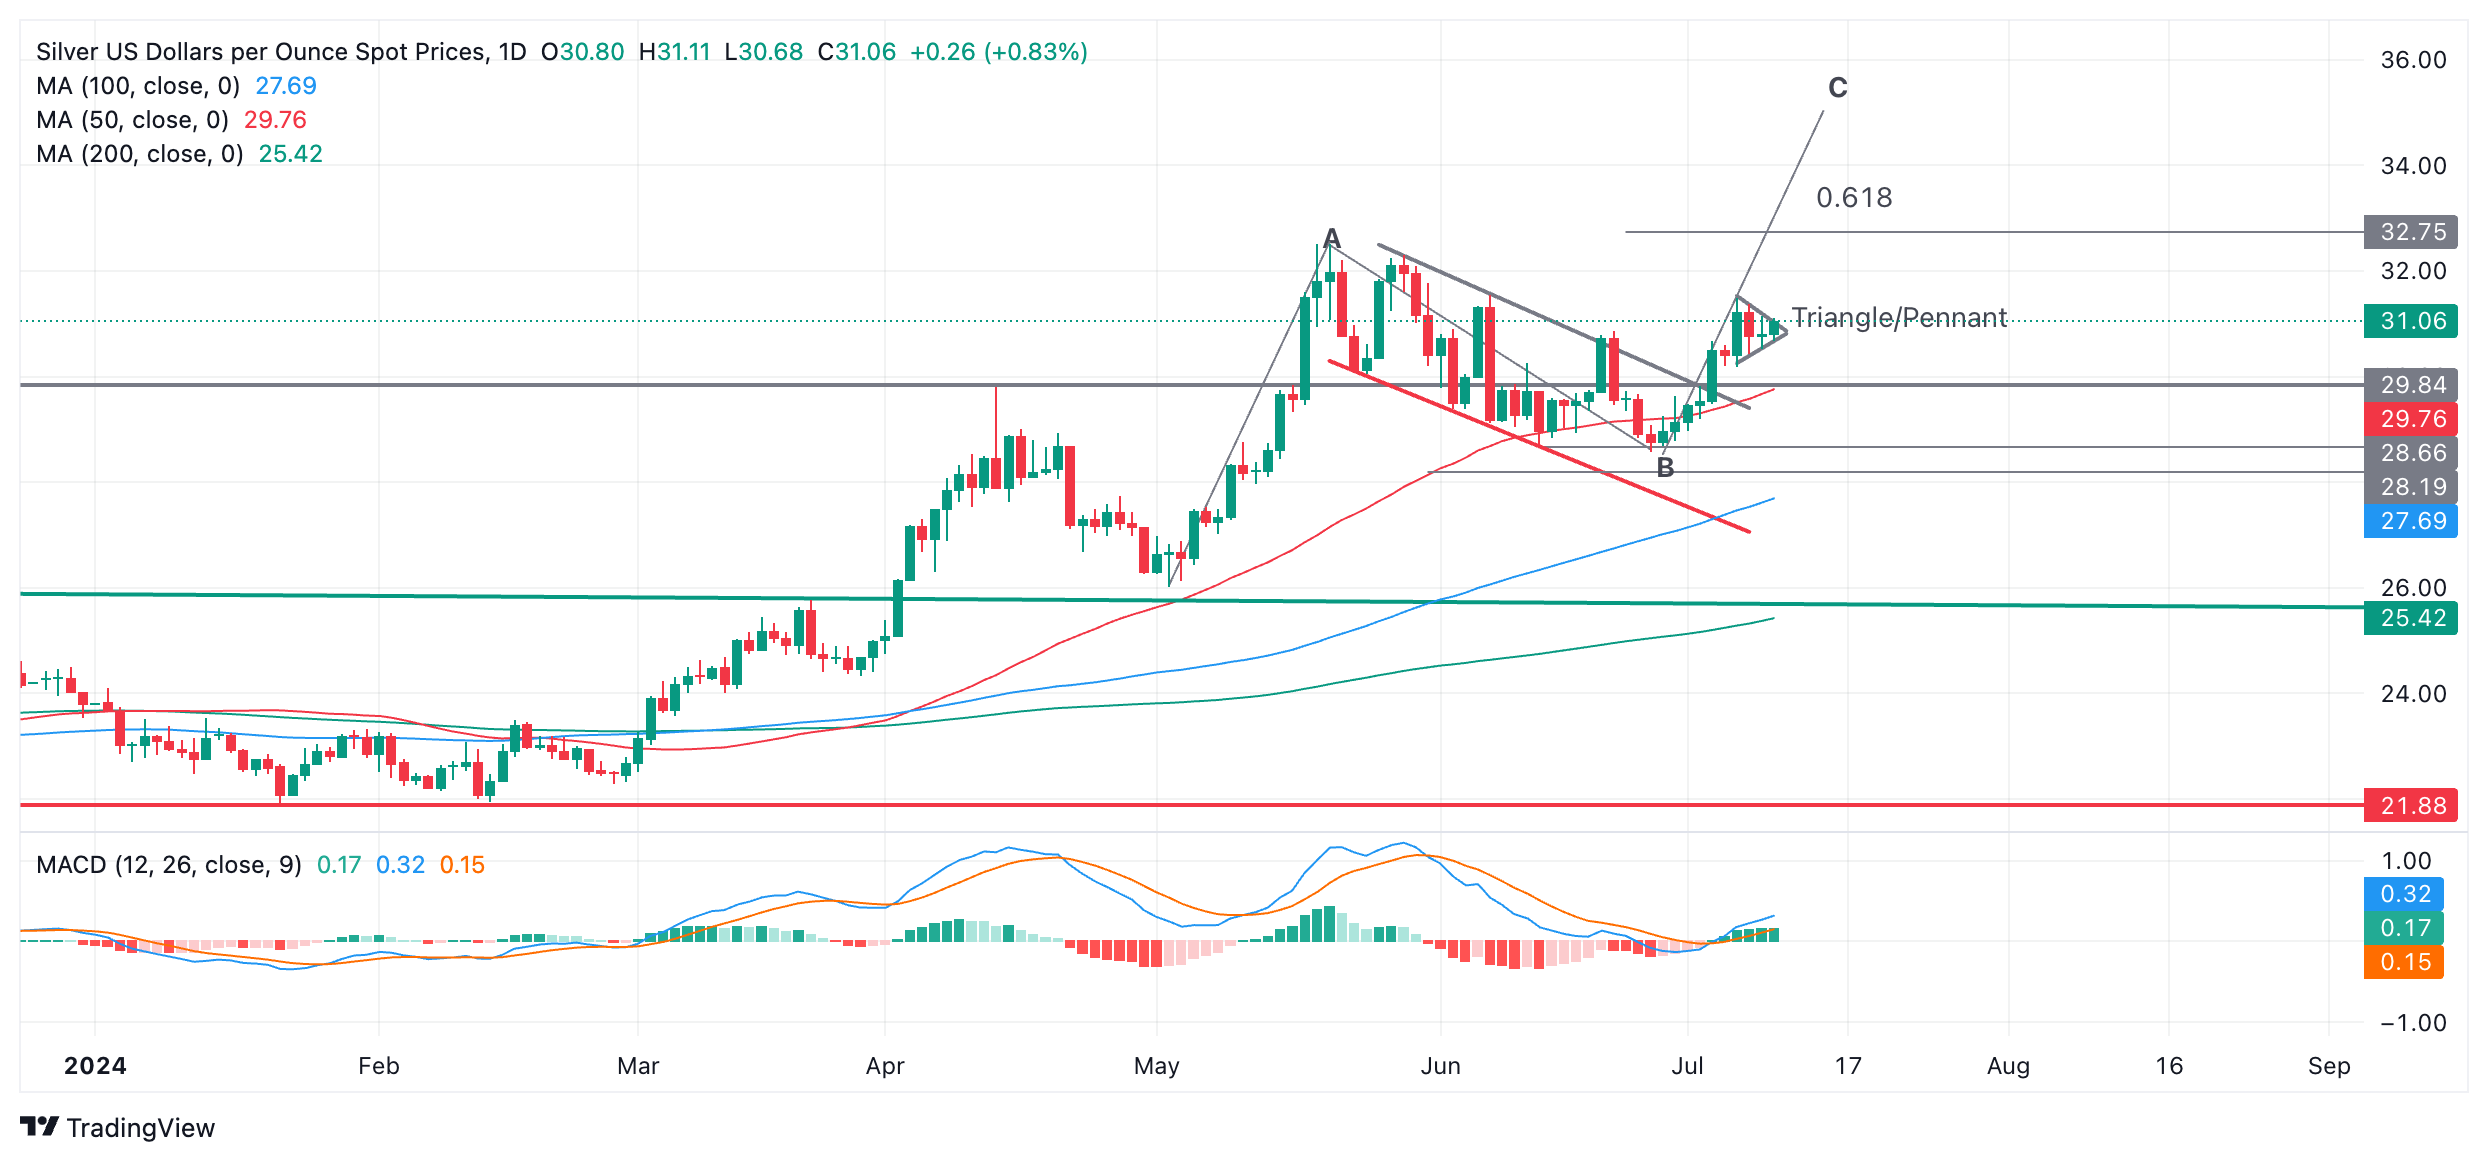
More broadly, Silver is also likely in the process of rising in the final wave C of a three-wave measured move (MM), with a final price target substantially higher than the current market level.
TSs do not give a clue as to the direction of the breakout, but it is usually in the direction of the previous trend. Bullish pennants, however, are bullish and strongly suggest higher prices to come.
The measured movements are like large zigzags composed of three waves, sometimes labeled A, B and C.
As the price of Silver is currently rising in wave C, it is likely to rise further, either until it reaches the end of wave C or, more conservatively, $32.75 (calculated as the 0.618 extrapolation of wave A). If it reaches the end of C, it could rally up to $35.00.
A break above the TS/pennant top at $31.49 would provide confirmation of the next leg higher.
The MACD momentum indicator has crossed above the zero line and looks set to continue rising, with bullish implications for the price.
Source: Fx Street
I am Joshua Winder, a senior-level journalist and editor at World Stock Market. I specialize in covering news related to the stock market and economic trends. With more than 8 years of experience in this field, I have become an expert in financial reporting.


