
- The price of Silver falls back on Monday and breaks a streak of three consecutive days of gains to two-month highs.
- The technical situation favors the bulls and supports the possibility of further buying at lower levels.
- Any significant corrective dip could now be seen as a buying opportunity and remain limited.
The price of Silver (XAG/USD) starts the week with a weaker tone and, for the moment, seems to have interrupted a three-day streak of gains to the psychological level of $25.00, its highest level since the 11th of May, which played on Friday. The white metal remains on the defensive early in the European session and is currently trading around the $24.75-$24.80 zone, down almost 0.70% on the day, though a fall looks unlikely. significant.
Against the backdrop of the recent nice bounce from near the $22.00 level, or a three-month low hit in June, Friday’s sustained break through the $24.50-$24.60 area was seen as another trigger for bulls. This, along with the bullish technical indicators on the daily chart, validates the positive outlook for XAG/USD and supports the prospects for some buying to emerge at lower levels.
Therefore, any further decline is more likely to find decent support near the $24.50 region, which if broken decisively could trigger some technical selling and drag XAG/USD towards a test of the $24.00 level. This is followed by supports near the $23.65-$23.60 zone and the $23.20-$23.15 zone. A convincing break below the round $23.00 level will nullify the positive outlook and shift the bias in favor of the bears.
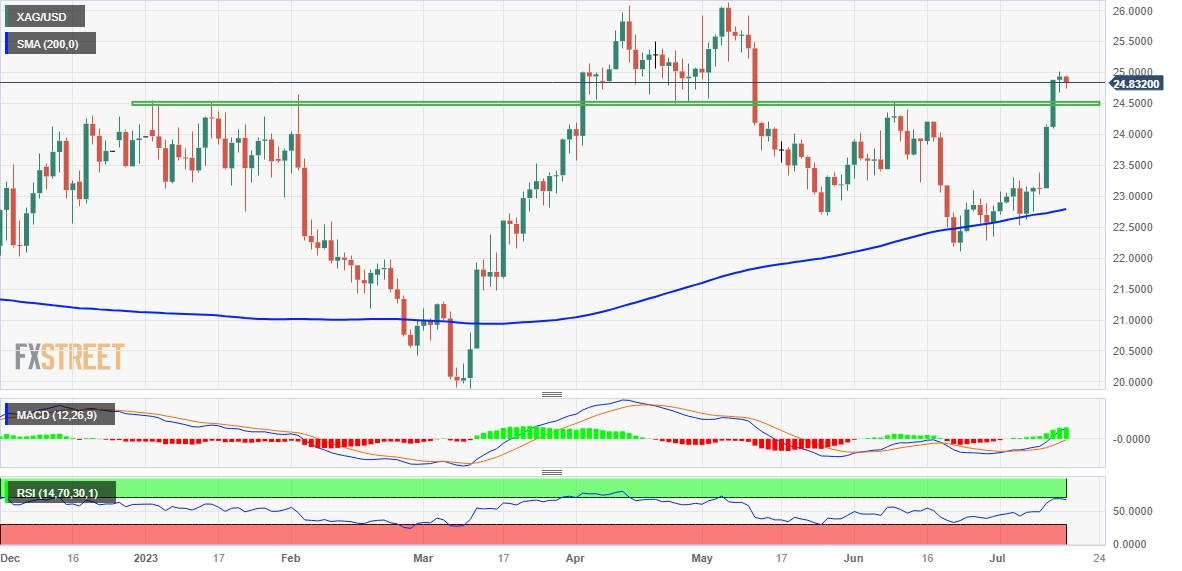
On the other hand, the bulls could wait to break above the $25.00 level before positioning to push further towards the next major hurdle near the $25.50-$25.55 zone. The bullish trajectory could extend further towards a recovery of the round $26.00 level before XAG/USD challenges the yearly high around the $26.10-$26.15 region touched in May.
silver daily chart
Silver additional technical levels
Source: Fx Street
I am Joshua Winder, a senior-level journalist and editor at World Stock Market. I specialize in covering news related to the stock market and economic trends. With more than 8 years of experience in this field, I have become an expert in financial reporting.


