
- Silver is recovering within a descending channel.
- It has found strong resistance at the level of the 50 and 100 period SMAs on the 4-hour chart.
- There are bullish signs, but a breakout of the channel would be a prerequisite for a more confident stance.
The Silver (XAG/USD) continues to recover within a descending channel. The precious metal found support at the June 26 and June 13 lows (around 26.88). Its first attempt to break above the cluster of moving averages in the $29.40 area failed, but after its pullback on July 1 it has started to rise again.
Silver 4 hour chart
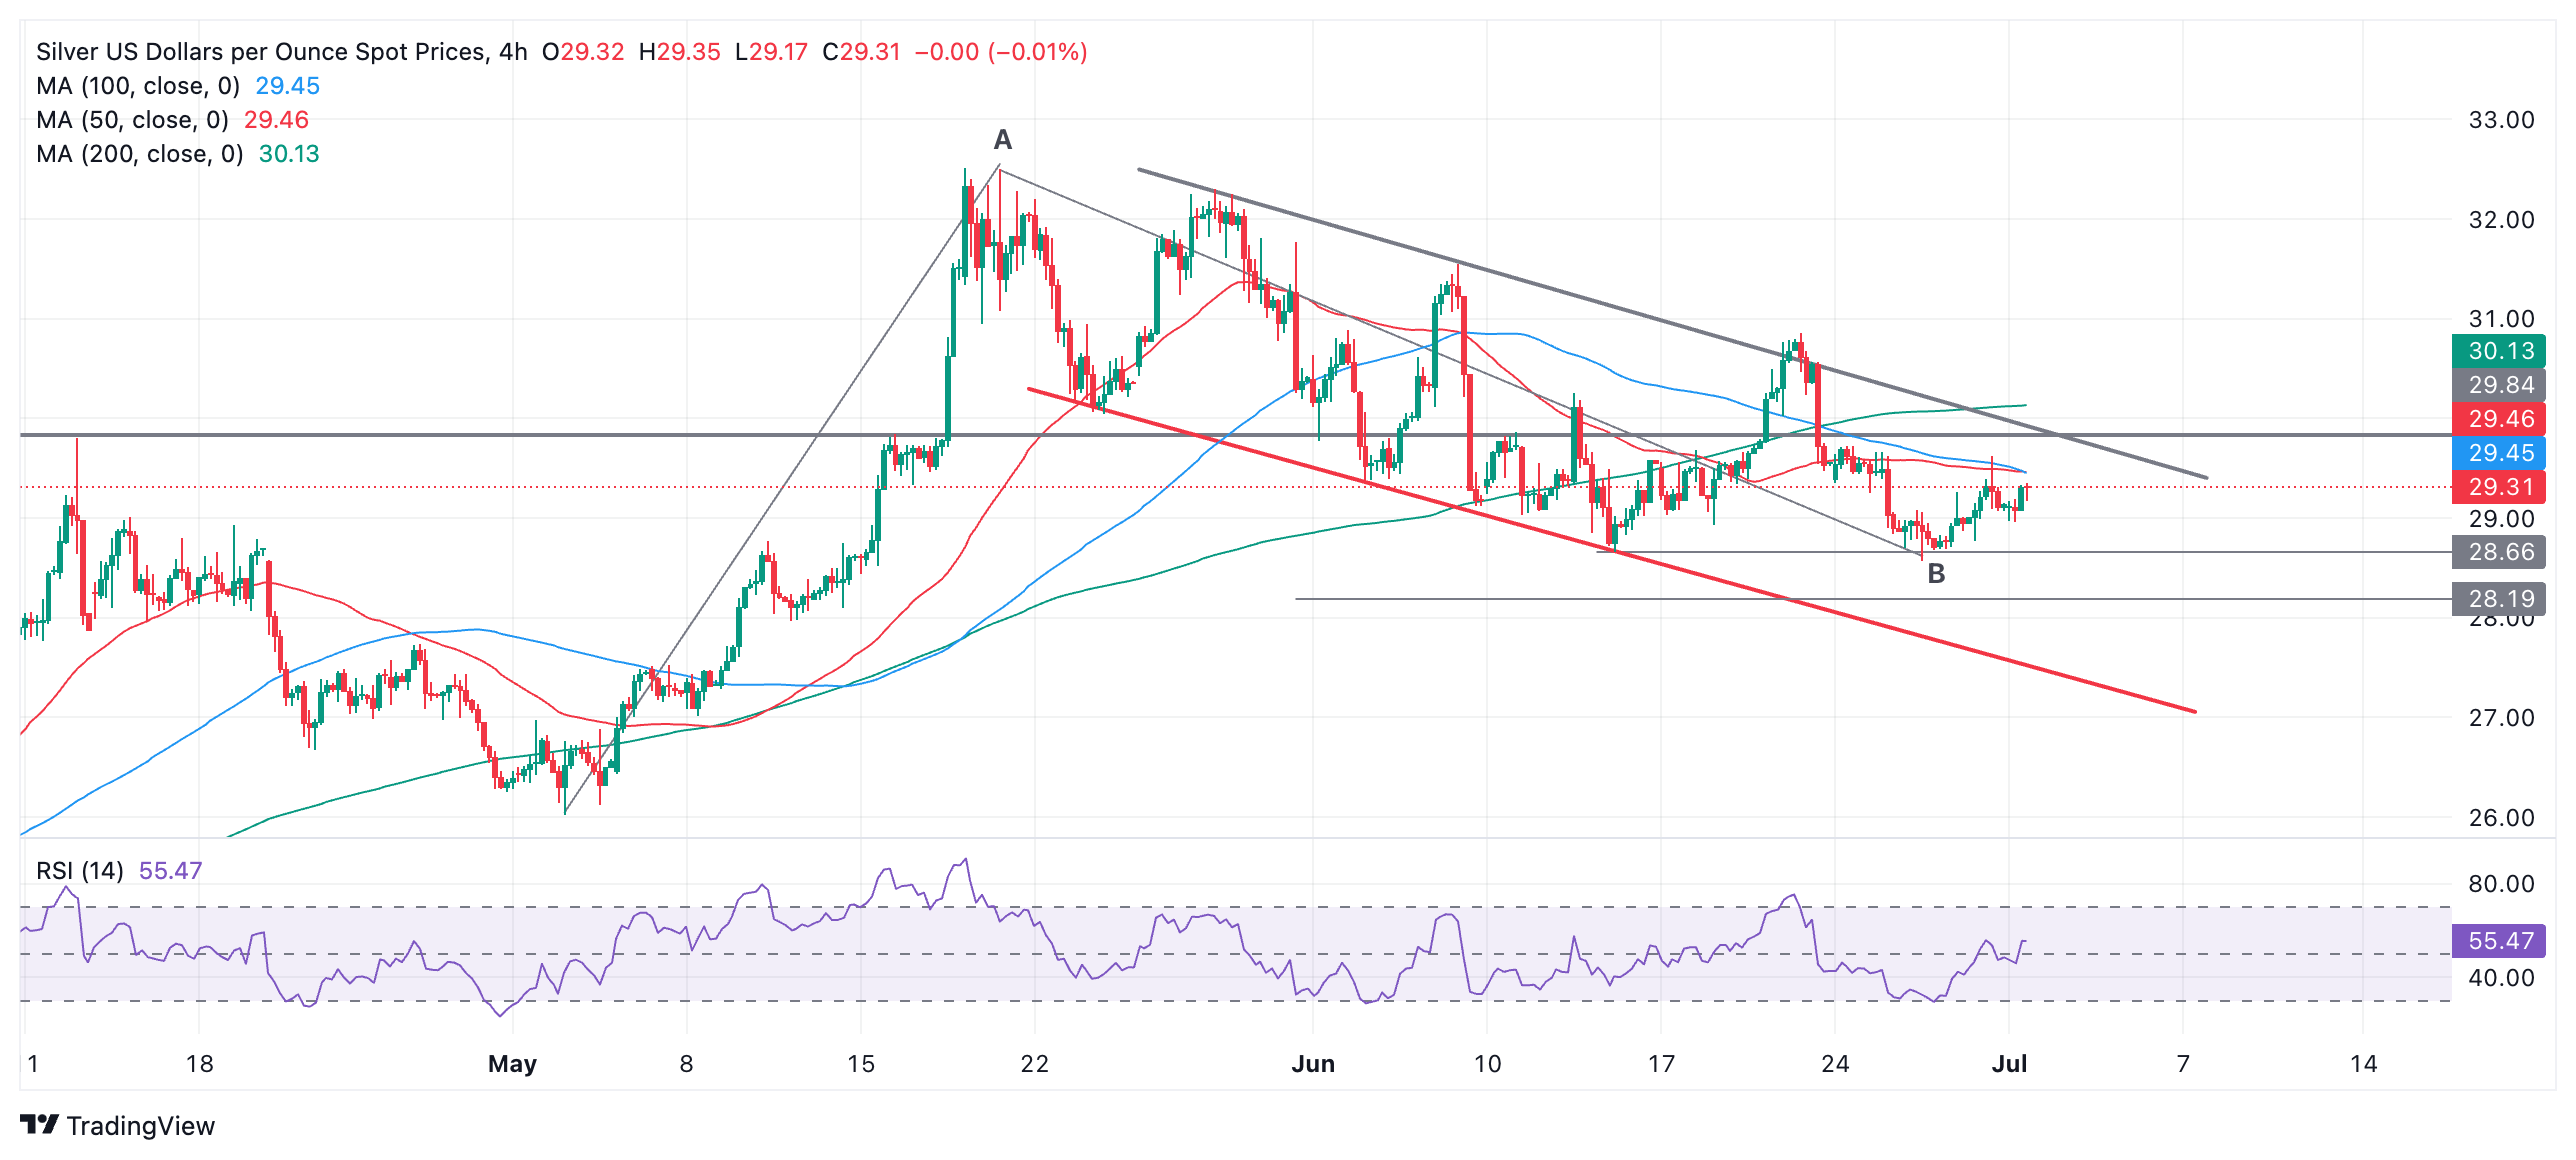
It is now debatable whether Silver is still in a short-term downtrend, meaning there is no longer a downside bias. However, it is in a descending channel, which adds a bearish tone to the charts.
Therefore, if the price returns below $28.57, the June 26 low, the downside bias would be reconfirmed, with the next target at the lower channel line, around $27.50.
If Silver continues to rally and breaks above the 50 and 100 SMAs on the close, it would signal an upside continuation towards the upper channel line around $29.90. This would be a critical crossover for the pair. It is also an important resistance level at the top of a four-year consolidation zone. A decisive break above would signal the start of a new short-term uptrend.
A decisive breakout would be one accompanied by a long green candle that breaks clearly above the level and closes near its high or three consecutive green candles breaking above the level.
Silver temporarily broke the top of the descending channel on June 20th, and although it quickly fell back down, the fact that it broke the integrity of the channel, albeit temporarily, indicates that the upper line of the channel has weakened and is more likely to give way again. This also adds a slightly bullish note to the charts.
The rally during the start of May also gives the chart a more bullish look. One view might suggest that this rally was an “A” wave and the entire descending channel is the second major wave, or “B” wave, of a Measured Movement (MM) pattern to the upside. MMs are three-wave zig-zags. If so, this could indicate a move of a similar length to the upside, in a “C” wave. Such a move, if it materializes – and it is still too early to tell – would likely take Silver to around $33.00.
Source: Fx Street
I am Joshua Winder, a senior-level journalist and editor at World Stock Market. I specialize in covering news related to the stock market and economic trends. With more than 8 years of experience in this field, I have become an expert in financial reporting.


