
- The price of Silver continues to climb higher on Friday and rebounds to a nearly three-week high.
- A move above the 50% Fibonacci level could have set the stage for a new move higher.
- Any corrective decline is more likely to find support near the $23.30 confluence.
Silver price (XAG/USD) extends the previous day’s solid recovery move from the $22.80 area, or weekly low, and gains strong follow-through traction on Friday. This is the third consecutive positive day, and also the fifth of the previous six, and lifts the white metal to a two-and-a-half-week high, around the $23.75 area during the European session.
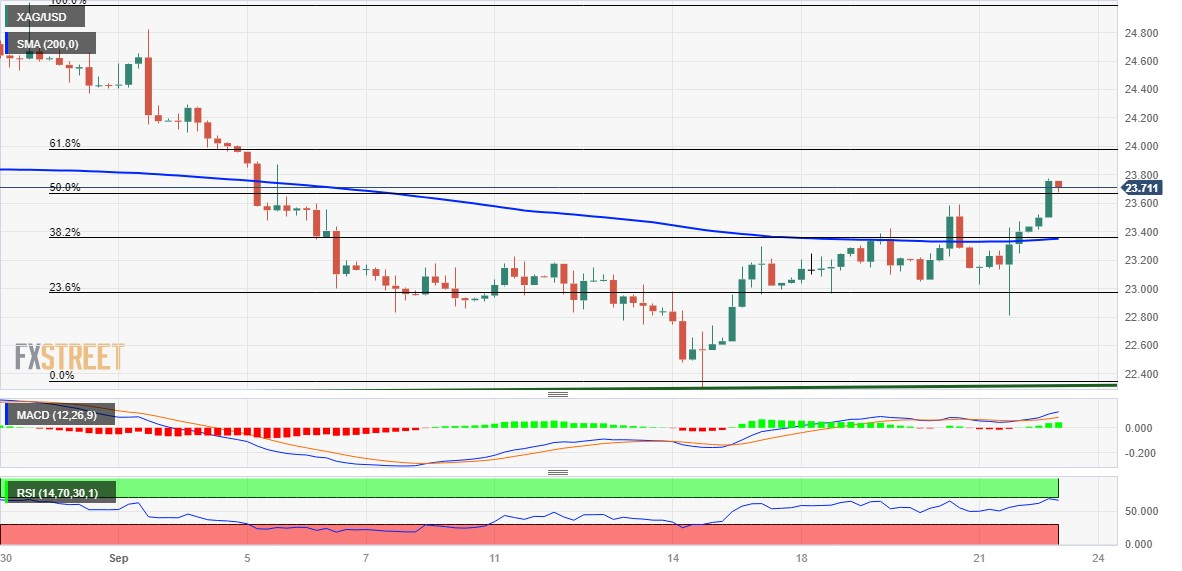
From a technical point of view, a move beyond the 50% Fibonacci retracement of the August-September decline could be considered a new trigger for XAG/USD bulls. Furthermore, the oscillators on the daily chart have just started moving into positive territory and support the prospects of a new appreciation move. Therefore, further strengthening towards the recovery of the round level of $24.00, which coincides with the 61.8% Fibonaci, seems a clear possibility.
Some follow-through buying will set the stage for an extension of the recent rally from an ascending trend line extending from the June low. XAG/USD could then accelerate momentum beyond the intermediate hurdle of $24.30-$24.35, towards the psychological level of $25.00, the August monthly high. The next relevant hurdle lies near the July high, around the $25.25 region, which if cleared decisively should pave the way for additional gains.
On the opposite side, any significant corrective decline seems to find good support near the $23.30 confluence, which comprises the 200-4-hour SMA and the 38.2% Fibonacci. The next relevant support lies near the $23.00 round level, below which XAG/USD could pull back to retest the $22.30 support, a nearly one-month low touched last Thursday. A convincing break below would change the bias in favor of the bears.
4-hour chart of the price of Silver
Silver additional technical levels
Source: Fx Street
I am Joshua Winder, a senior-level journalist and editor at World Stock Market. I specialize in covering news related to the stock market and economic trends. With more than 8 years of experience in this field, I have become an expert in financial reporting.


")

