
- The price of Silver continues to be sold for the second consecutive day and is approaching the weekly low.
- The technical situation favors the bears and supports the prospects for further losses in the short term.
- Sustained strength above the $23.60-$23.70 resistance zone is needed to negate the negative bias.
The price of Silver (XAG/USD) retreated for the second day in a row on Friday, also marking the third day of negative movement in the previous four, and fell to the lower end of its weekly range during the early stages of the European session. The white metal is currently trading around the $22.65-$22.60 zone, down more than 0.50% on the day, and appears vulnerable to weakening further.
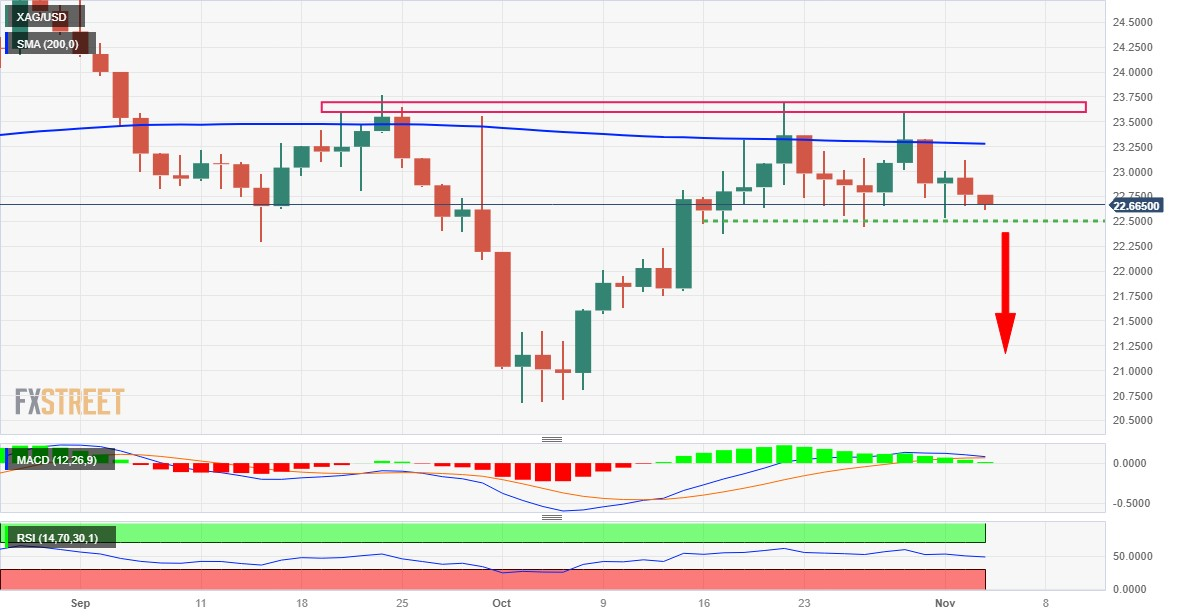
Recent repeated failures to find acceptance above the 200-day SMA and rejections near the $23.60-$23.70 resistance zone constitute the formation of a multiple high pattern. Furthermore, technical indicators on the daily chart have once again gained negative traction and validate the short-term bearish outlook for XAG/USD. That said, it would be prudent to wait for selling below the $22.50 support zone before positioning for additional losses.
Then, XAG/USD could accelerate the decline towards the $22.00 level before falling to the $21.70 horizontal support zone en route to the $21.35-$21.30 region. The bearish trajectory could extend further and drag the white metal below the $21.00 level, towards the $20.70-$20.65 area, or a seven-month low touched in October.
On the other hand, the round level of $23.00 seems to limit the immediate upside ahead of the horizontal barrier of $23.10-$23.15. It is closely followed by the 200-day SMA, currently around the $23.25 zone, above which XAG/USD could challenge the $23.60-$23.70 resistance zone. This last level should act as a key point, which if broken decisively will nullify the negative outlook and change the short-term bias in favor of the bulls, paving the way for a move towards the $24.00 level.
Some follow-through buying has the potential to lift
Daily Silver Price Chart
Additional technical levels
Source: Fx Street
I am Joshua Winder, a senior-level journalist and editor at World Stock Market. I specialize in covering news related to the stock market and economic trends. With more than 8 years of experience in this field, I have become an expert in financial reporting.


