
- Silver remains on the defensive for the third day in a row, though it lacks follow-up selling.
- The technical situation continues to favor the bulls and supports the prospects for further gains in the short term.
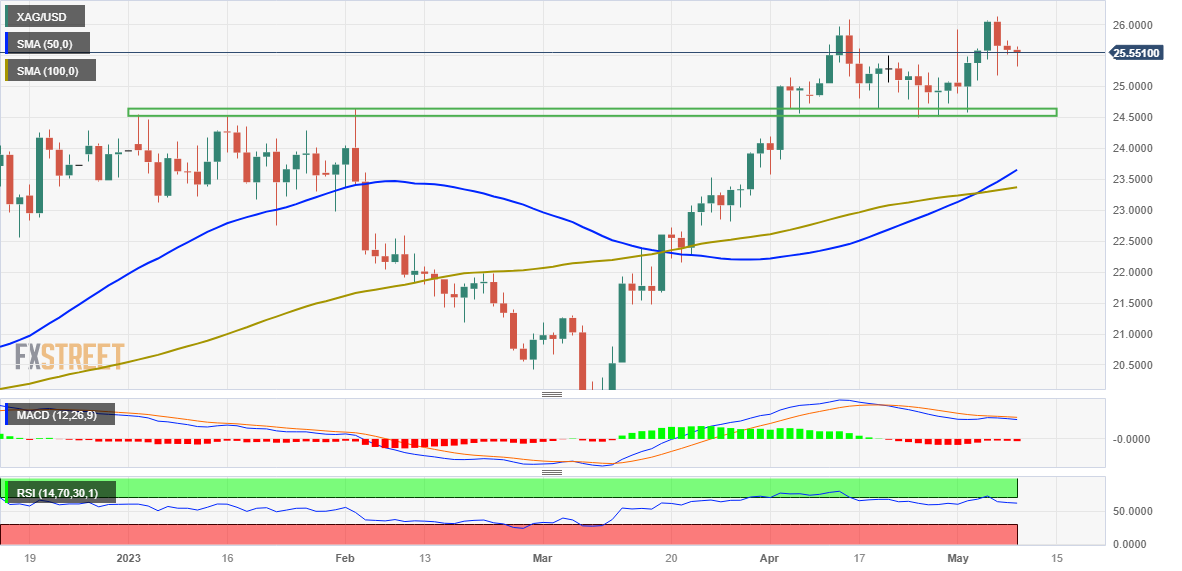
- A convincing break below the $24.50-$40 zone is needed to nullify the constructive outlook.
The silver It recovers some of its modest intraday losses, but is struggling to capitalize on the move and is trading slightly negatively for the third day in a row on Tuesday, around $25.00.
From a technical standpoint, the lack of follow-up selling warrants some caution before confirming that XAG/USD has made a short-term top and positioning for any significant pullback from last Friday’s 1-year high. Furthermore, recent repeated bounces from the breakout of the strong horizontal resistance at $24.50-$24.40, now turned support, favor the bulls.
This, along with the positive oscillators on the daily chart, suggests that the path of least resistance for the white metal is to the upside. That being said, XAG/USD has struggled to find acceptance above the $26.00 signal, warranting caution from bulls. However, XAG/USD looks set to break through the $26.25-$26.30 barrier and rally to the $27.00 area, or the March 2022 high.
On the other hand, the low on Friday, around $25.15, could serve as support and protect immediate falls. It is closely followed by the psychological signal at $25.00, below which XAG/USD could extend the corrective decline towards testing resistance-turned-support at $24.50-$24.40. A convincing break below the latter is needed to negate the short-term positive outlook.
Then, XAG/USD could weaken further below the $24.00 signal and fall to the next relevant support near the $23.50-$23.30 confluence. The latter comprises the 50-day and 100-day SMAs and is followed by support near $23.00.
silver daily chart
Key levels to watch
Source: Fx Street
I am Joshua Winder, a senior-level journalist and editor at World Stock Market. I specialize in covering news related to the stock market and economic trends. With more than 8 years of experience in this field, I have become an expert in financial reporting.


