
- Silver attracts some buying near the $19.00 level, above the one-week low hit on Wednesday.
- The bearish technical setup suggests that the bounce attempt risks fading quickly.
- Traders could wait for a sustained break below the $19.00 level before opening further bearish positions.
Silver finds some support near the $19.00 level and staged a modest recovery from a one-week low hit on Wednesday. This rally allows the white metal to break a three-day losing streak and halt its recent sharp pullback from the $21.25 area, the highest level since late June.
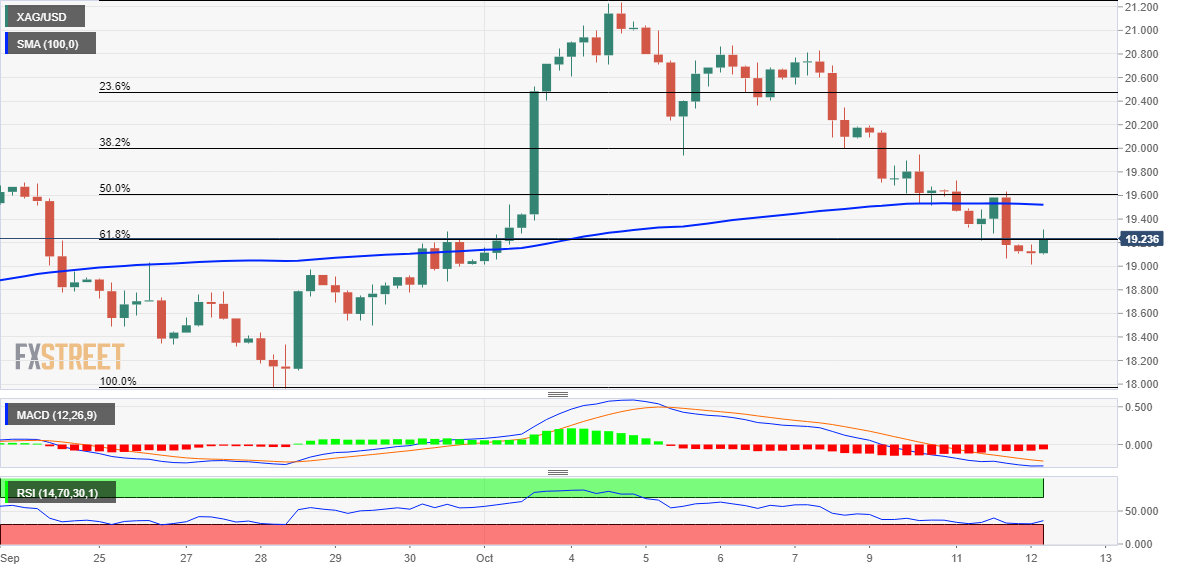
Technically, any further move to the upside is likely to face stiff resistance near the $19.55-$19.60 confluence support breakout point. This zone comprises the 50% Fibonacci retracement of the recent recovery from the yearly low and the 100-period SMA on the 4-hour chart. This, in turn, should act as a pivot point and help determine the short-term path of XAG/USD.
A convincing break of the aforementioned barrier will suggest that the recent decline is over and will lift spot prices back towards the psychological $20.00 level. The latter coincides with the 38.2% Fibonacci, above which XAG/USD could rise to the 23.6% Fibonacci, around the $20.40 zone. The momentum could extend further towards the recovery of the $21.00 level.
Meanwhile, the oscillators on the daily chart have just entered negative territory and maintain their bearish bias on the 4-hour chart. The setup supports the prospect of further losses. Sustained weakness below the $19.00 level is needed to reaffirm the outlook. XAG/USD could then slide towards the $18.60 zone before falling to the $18.35 and $18.00 zone.
Silver 4 hour chart
silver key levels
Source: Fx Street
With 6 years of experience, I bring to the table captivating and informative writing in the world news category. My expertise covers a range of industries, including tourism, technology, forex and stocks. From brief social media posts to in-depth articles, I am dedicated to creating compelling content for various platforms.


