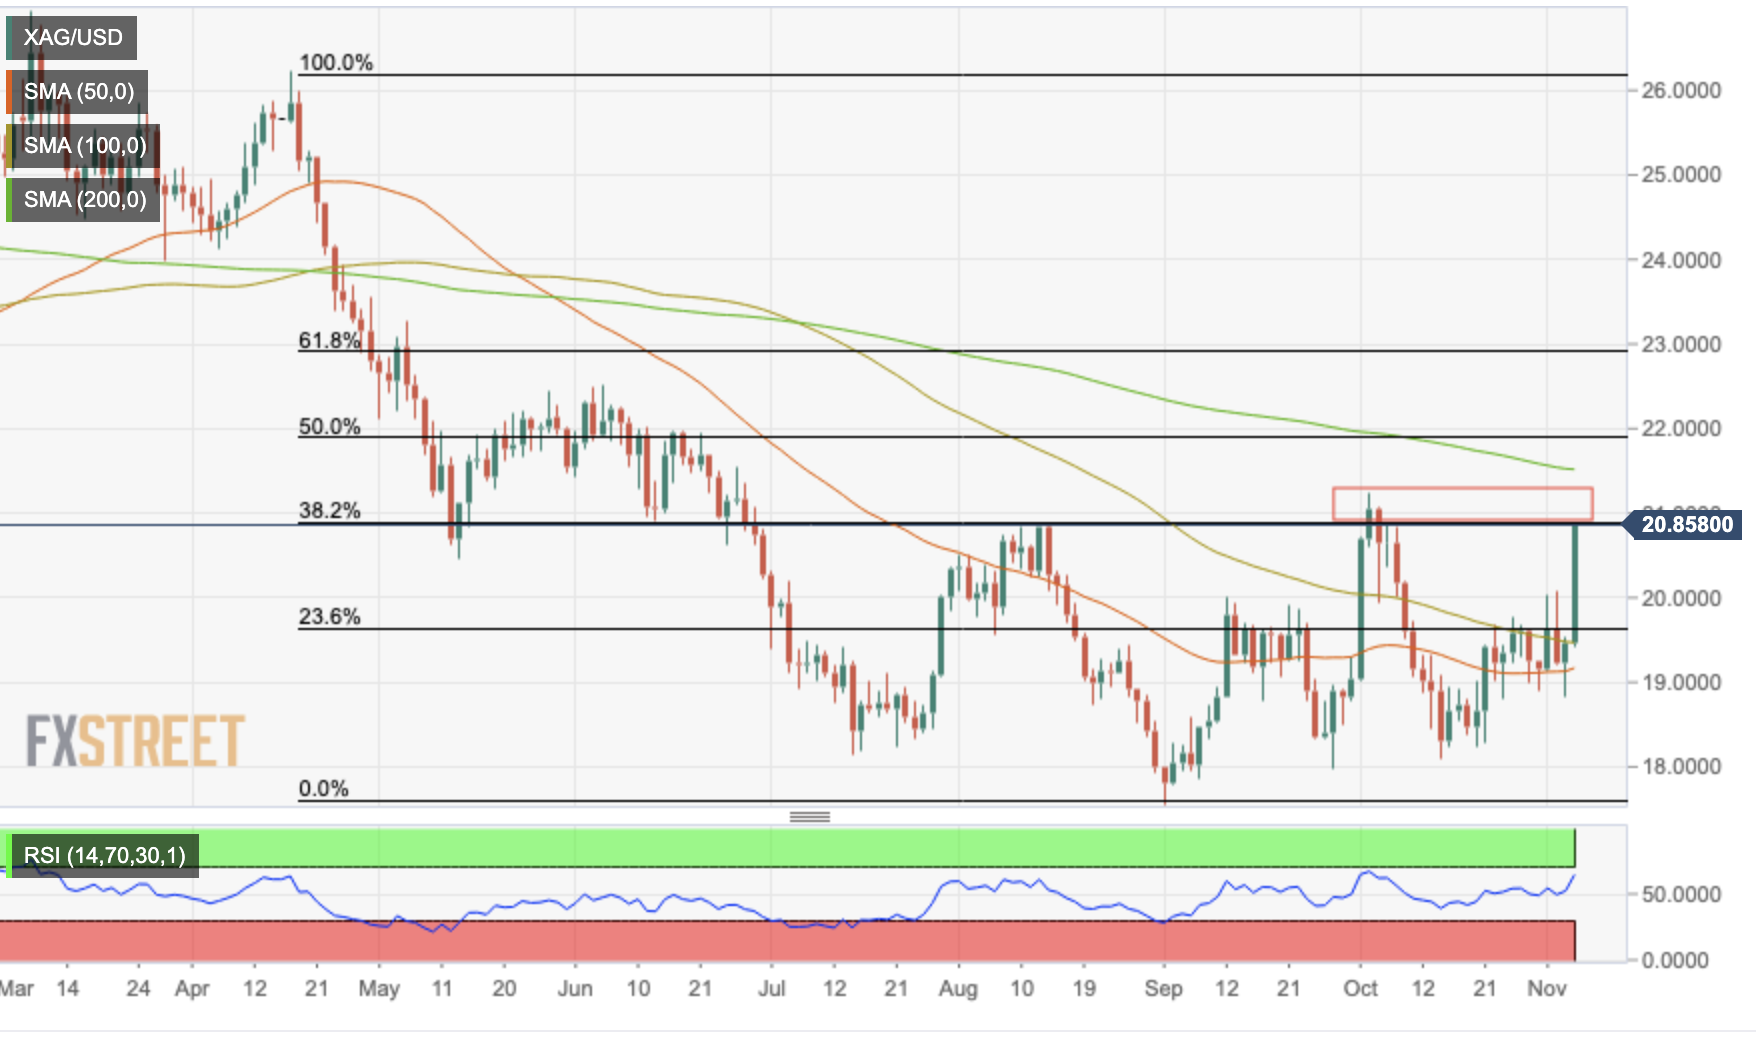
- Silver prices rise 7% and hit three-week highs near $21.
- Dollar falls as US labor markets show signs of easing.
- XAGUSD has reached a major resistance level at $20.90.
Silver prices soared on Friday, buoyed by a weak US dollar, following a mixed US non-farm payrolls report. The precious metal gained nearly 7% on the day, breaking above the top of the last two weeks trading range around $20 to hit a three-week high of $20.80 so far.
US dollar sinks as labor market shows signs of easing
The release of the US Non-Farm Payrolls report sent the dollar down today. Non-private payrolls rose to 261,000 in October, beating expectations for a rise of 200,000, and the September figure has been revised up to 315,000 from 264,000 initially estimated.
Elsewhere, the unemployment rate has risen to 3.7% from 3.5% in September and wage inflation has slowed to 4.7% from 5% in the previous month. These figures suggest that labor market conditions may be easing, putting the possibility of a moderate turn in December back on the table.
XAGUSD is approaching the resistance of $20.95 dollars
From a technical point of view, silver is now just below a major resistance zone at $20.90, where the 6-7 Oct highs meet the 38.2% Fibonacci retracement of the April-September decline. .
With the pair reaching overbought levels on the hourly and daily charts, a moderate pullback should be seen before a further recovery.
To the upside, above $20.90, the next potential targets are the Oct 4 high at $21.25 and. The 200-day SMA at $21.55.
To the downside, the $20.55 intraday level is holding off the bears for now, with the next potential targets at the previous resistance at $20.00 and the 50-day SMA at $19.20.
XAGUSD daily chart

Technical levels to watch
XAG/USD
| Overview | |
|---|---|
| last price today | 20.87 |
| today daily change | 1.40 |
| Today’s daily variation in % | 7.19 |
| Daily opening today | 19.47 |
| Trends | |
|---|---|
| daily SMA20 | 19.18 |
| daily SMA50 | 19.13 |
| daily SMA100 | 19.48 |
| daily SMA200 | 21.51 |
| levels | |
|---|---|
| Previous daily high | 19.55 |
| Previous Daily Low | 18.84 |
| Previous Weekly High | 19.78 |
| Previous Weekly Low | 18.79 |
| Previous Monthly High | 21.24 |
| Previous Monthly Low | 18.09 |
| Daily Fibonacci 38.2% | 19.27 |
| Daily Fibonacci of 61.8% | 19.11 |
| Daily Pivot Point S1 | 19.02 |
| Daily Pivot Point S2 | 18.57 |
| Daily Pivot Point S3 | 18.31 |
| Daily Pivot Point R1 | 19.73 |
| Daily Pivot Point R2 | 19.99 |
| Daily Pivot Point R3 | 20.44 |
Source: Fx Street
With 6 years of experience, I bring to the table captivating and informative writing in the world news category. My expertise covers a range of industries, including tourism, technology, forex and stocks. From brief social media posts to in-depth articles, I am dedicated to creating compelling content for various platforms.


