
- The XAG/USD pair is biased to the upside from a daily chart perspective, and could test this year’s high at $24.63.
- XAG/USD is in a solid uptrend, with oscillator support in bullish territory.
- XAG/USD could see a drop if it breaks below $23.50 as it could fall towards the S1 pivot point.
The price of the silver It broke a two-month trend line of resistance, hitting a fresh 8-week high of $23.92 on general US dollar (USD) weakness and falling US Treasury yields. Therefore, the XAG/USD pair is trading at $23.74, up more than 2%, after hitting a low of $23.24.
XAG/USD: Price Action
From a daily chart perspective, XAG/USD is biased to the upside and could soon test this year’s high of $24.63 once it recovers to $23.50. But first, silver buyers need to recoup $24.00, before challenging this year’s highs. The Relative Strength Index (RSI) in overbought conditions continues to point higher, while the Rate of Change (RoC) portrays buyers in command. If XAG/USD fails to break $24.00, it could pave the way for a pullback.
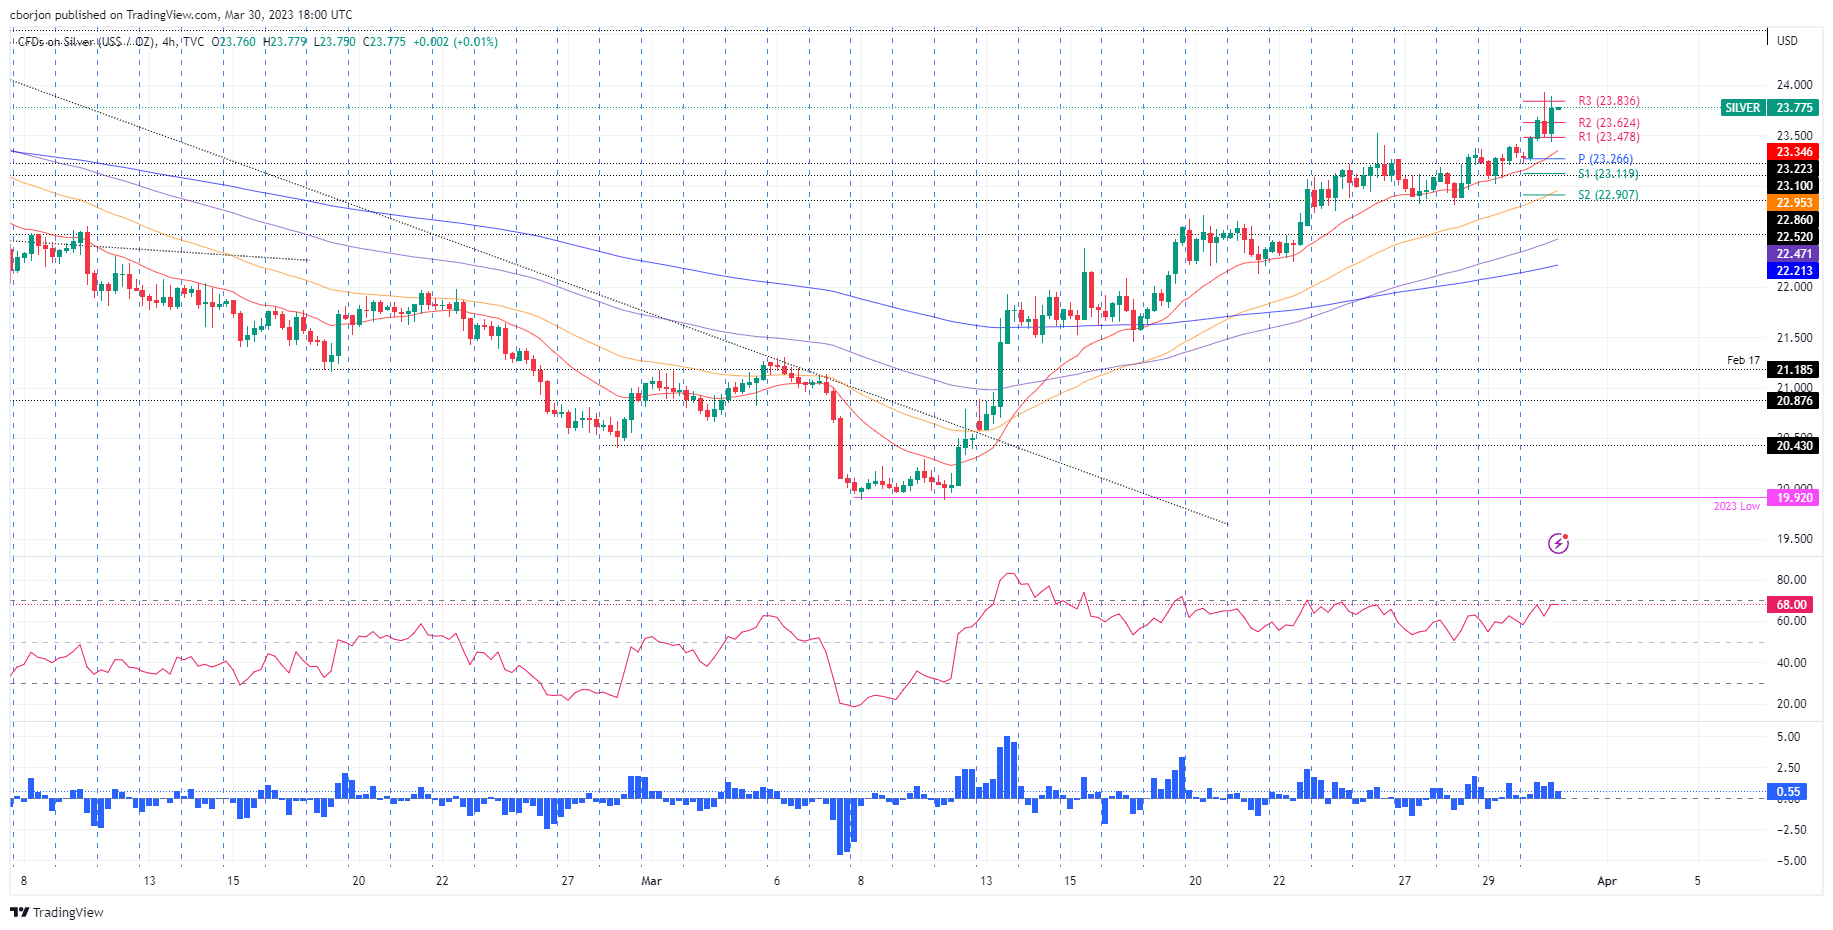
In the short term, the 4-hour chart for XAG/USD shows the white metal in a solid uptrend, testing the daily pivot point R3 at $23.83 after reaching a daily high of $23.92. If XAG/USD breaks above $24.00, it will hit its highest level so far this year. The RSI justifies a bullish continuation in bullish territory, while the RoC does as well.
On the flip side, if XAG/USD stumbles below the R2 daily pivot at $23.62, it would pave the way for further decline. Therefore, the first support for the XAG/USD would be the R1 pivot point at $23.47, followed by the intersection of the 20 EMA and the daily pivot point at $23.30, before dipping towards the S1 pivot point at $23.11.
XAG/USD 4-hour chart
XAG/USD Technical Levels
Source: Fx Street
I am Joshua Winder, a senior-level journalist and editor at World Stock Market. I specialize in covering news related to the stock market and economic trends. With more than 8 years of experience in this field, I have become an expert in financial reporting.


