
- Silver price confirms breakouts through a multi-day range and hits 1-year highs.
- On the daily chart, the RSI is showing overbought conditions and bulls should exercise caution.
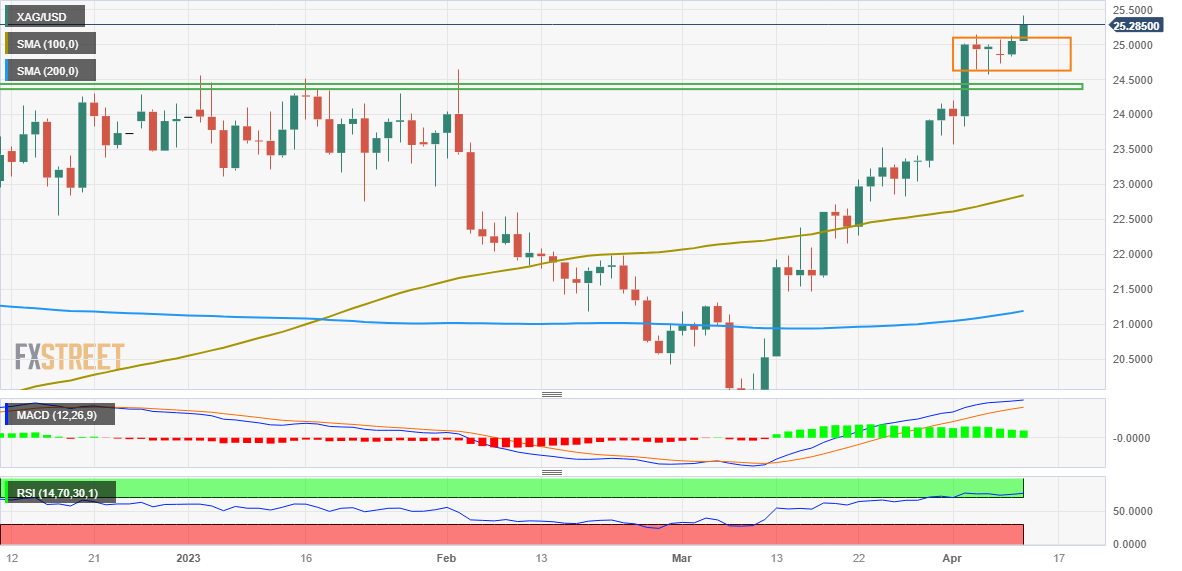
- Any corrective pullback below the $25.00 level is more likely to be bought and remain capped.
The price of silver (XAG/USD) is gaining strength, reaching 1-year highs around $25.40 during the early stages of the European session on Wednesday. The white metal appears to have confirmed a bullish break above a four-day consolidation and looks poised to extend its recent bull run seen over the past month.
That being said, the Relative Strength Index (RSI) on the daily chart is already showing overbought conditions and warrants some caution for bulls. Therefore, it would be prudent to wait for a short-term consolidation or moderate pullback before positioning for any further short-term upside in XAG/USD. In the meantime, any corrective dip is more likely to find decent support near the psychological $25.00 level.
Sustained weakness below that level could spark some technical selling and drag XAG/USD towards the breakout of the $24.30-$24.40 horizontal resistance, now turned support. Such an area would act as a turning point, and if broken decisively, the white metal could weaken below the $24.00 level and test the $23.60 to $23.55 support area, before finally falling to the $23.15 area below. way to the $23.00 round level.
On the flip side, momentum beyond the $25.40 zone, or the yearly high, could extend and allow XAG/USD to recapture the $26.00 level. The next major hurdle lies near the $26.20 zone, ahead of the $26.40-$26.50 zone, above which the bulls could try to reach the 2022 high, just ahead of the $27.00 level.
silver daily chart
Silver additional technical levels
Source: Fx Street
I am Joshua Winder, a senior-level journalist and editor at World Stock Market. I specialize in covering news related to the stock market and economic trends. With more than 8 years of experience in this field, I have become an expert in financial reporting.


 has expected storms; look")
