
- Silver attracts some continuation buying for the second day in a row on Wednesday.
- Mixed technical indicators on hourly/daily charts warrant some caution for bulls.
- A break below the $28.00 mark is needed to negate any near-term positive outlook.
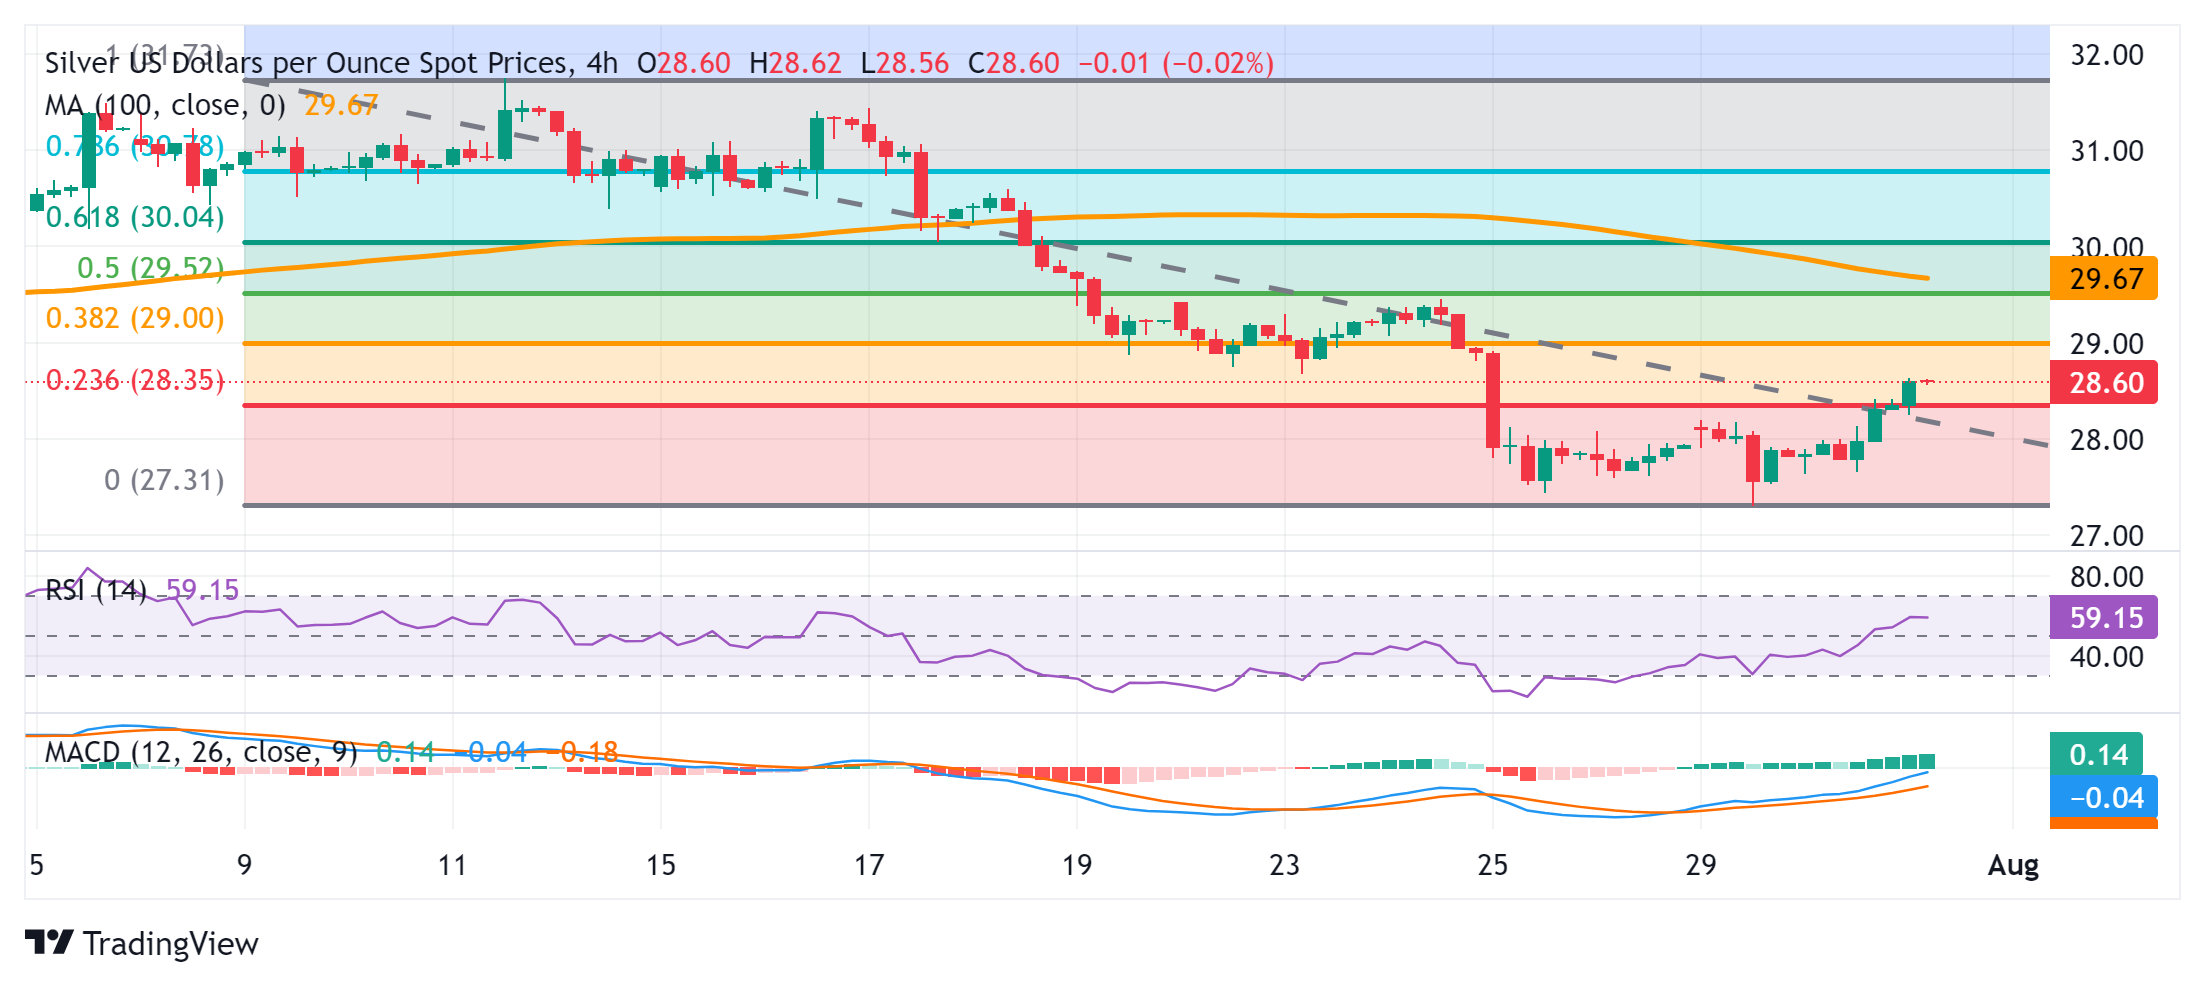
Silver (XAG/USD) is up for the second consecutive day on Wednesday and hits a multi-day high during the Asian session on Wednesday. The white metal is currently trading around the $28.60 region, with bulls now looking to build on the momentum beyond the support-turned-resistance breakout point of the 100-day simple moving average (SMA).
An intraday move beyond the 23.6% Fibonacci retracement level of the recent corrective decline from the $31.75 region, or the July monthly high, could be seen as a trigger for bullish traders. Moreover, oscillators on the 4-hour chart have been gaining positive traction and support prospects for a fresh intraday up-move. That said, technical indicators on the daily chart, though have rebounded from lower levels, are still far from confirming a positive outlook.
Therefore, any subsequent upside move is more likely to face stiff resistance and remain capped near the $29.00 mark, which coincides with the 38.2% Fibonacci level and should act as a key pivot point. Sustained strength beyond it, meanwhile, will suggest that the recent decline witnessed over the past two weeks or so has come to an end and lift the XAG/USD towards the next relevant hurdle near the $29.45-$29.50 resistance zone, or last week’s high and the 50% Fibonacci level.
Some follow-through buying should pave the way for a move back towards reclaiming the psychological $30.00 mark, or the 61.8% Fibonacci level. The momentum could further extend towards the 78.6% Fibonacci level, around the $30.75-$30.80 region, before the XAG/USD pair eventually aims to retake the $31.00 round figure and test the monthly high, around the $31.75 zone.
On the other hand, the $28.30-$28.25 region, or the 23.6% Fibonacci level, now seems to protect the immediate downside ahead of the $28.00 mark. A convincing break below the latter will expose the $27.40-$27.30 zone, or the lowest level since May 9 touched on Monday. The next relevant support lies near the $27.00 mark, below which the XAG/USD pair could accelerate the decline towards the $26.60-$26.55 support en route towards the 200-day SMA just below the $26.00 mark.
Silver 4 hour chart
Source: Fx Street
I am Joshua Winder, a senior-level journalist and editor at World Stock Market. I specialize in covering news related to the stock market and economic trends. With more than 8 years of experience in this field, I have become an expert in financial reporting.


