
- The price of Silver falls after reaching a high of almost seven months this Friday.
- The technical situation favors the bulls and supports the prospects for further increases.
- The slightly overbought RSI is the only headwind.
The price of Silver (XAG/USD) retreats from around $25.50, or a nearly seven-month high reached this Friday, and refreshes the daily low during the first part of the European session. The white metal, however, manages to stay above the psychological level of $25.00 and seems ready to extend its bullish trajectory of the last three weeks.
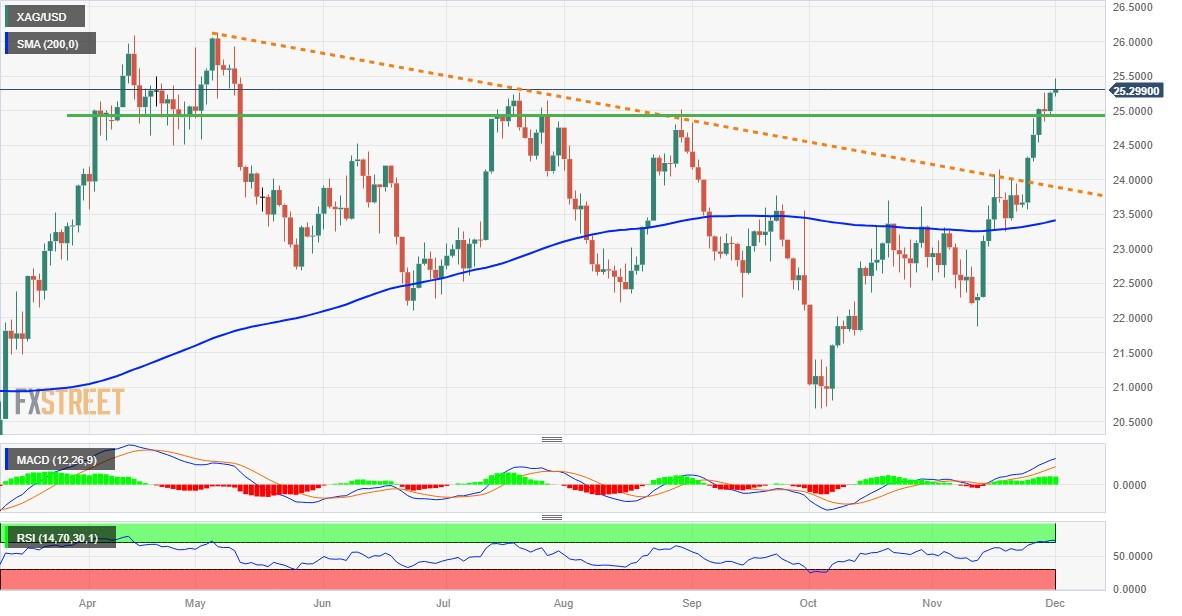
The recent break of the technically significant 200-day simple moving average (SMA), a several-month-old descending trend line, and the previous day’s close above the $25.00 level validate the positive near-term outlook for the XAG/USD. That said, the Relative Strength Index (RSI) on the daily chart is showing overbought conditions and stopping bulls from opening new positions. Therefore, it would be prudent to wait for a short-term consolidation or modest pullback before positioning for further gains.
From current levels, weakness below the round $25.00 level is likely to find some support near the $24.75-$24.70 area. Any further pullback could be considered a buying opportunity near the $24.20-$24.15 area and is likely to remain capped near the breakout point of the downtrend line resistance, around the $24.00 level. This last level should act as a key point, which if broken could trigger some technical selling and pave the way for a deeper corrective decline, to retest the 200-day SMA, near the $23.40-$23.35 area. .
On the other hand, the multi-month high, around the $25.45-$25.50 area, could now act as an immediate hurdle, above which XAG/USD could accelerate the momentum towards the recovery of the $26.00 level. . Some continuation buying above the yearly high, around the $26.15 area touched in May, will be seen as a new trigger for the bulls. The subsequent rise could take the white metal towards the $27.00 area, or the March 2022 yearly high.
Daily Silver Price Chart
Additional technical levels
Source: Fx Street
I am Joshua Winder, a senior-level journalist and editor at World Stock Market. I specialize in covering news related to the stock market and economic trends. With more than 8 years of experience in this field, I have become an expert in financial reporting.


")

