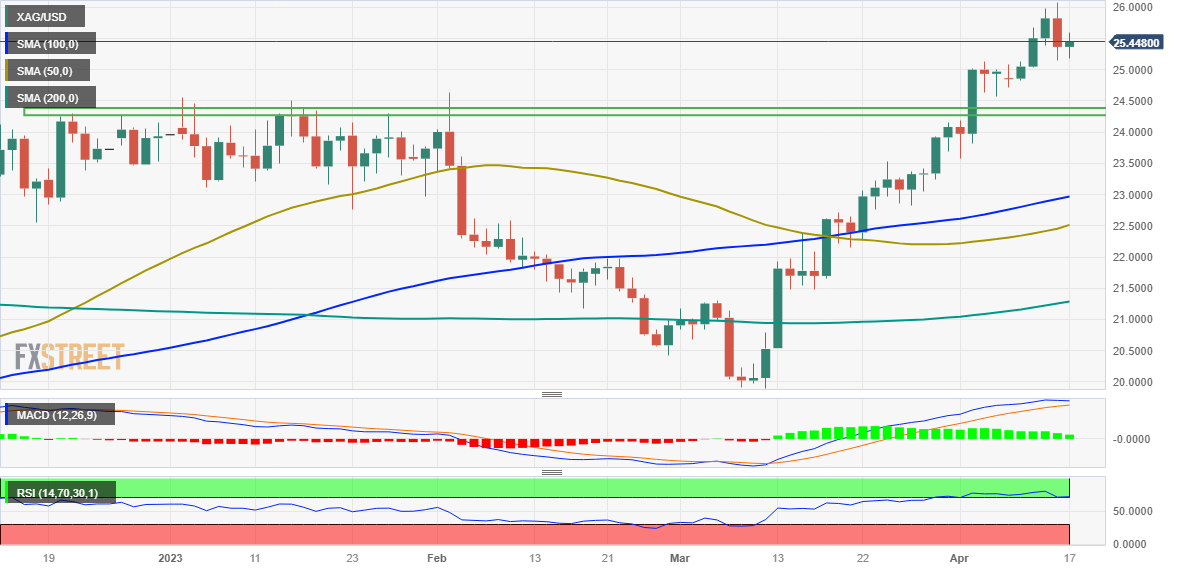
- Silver regains positive traction and reverses some of Friday’s pullback from the yearly high.
- The technical situation continues to favor the bulls and supports the prospects for further gains in the short term.
- A convincing break below the $25.00 signal would pave the way for a significant corrective drop.
The silver it attracts new buying on the first day of a new week and reverses some of Friday’s pullback from levels just above $26.00, or a new 1-year high. The white metal is holding on to its modest intraday gains around the $25.45 area heading into the North American session and looks poised to continue its recent rally seen over the past month or so.
The recent break of the strong horizontal barrier at $24.30-$24.40 and the subsequent move beyond the psychological level of $25.00 reinforce the positive near-term outlook for XAG/USD. That being said, the slightly overbought RSI on the daily chart could stop traders from making aggressive bets and keep any significant rally at bay, at least for now.
In the meantime, any intraday decline could continue to attract new buyers and remain capped near $25.00. The latter should act as a key point, which if broken decisively could trigger some technical selling and drag XAG/USD towards the resistance turned support of $24.30-$24.40 on the way to $24.00. A convincing break below the latter could turn the tide in favor of the bears.
On the other hand, bulls could wait for follow-through buying beyond the year-high around the $26.10 area touched on Friday before making further bets and positioning for a further appreciation move. XAG/USD could then rally towards the next relevant hurdle near the $26.40-$26.50 zone before finally trying to test the 2022 high just before $27.00.
silver daily chart

Key levels to watch
XAG/USD
| Overview | |
|---|---|
| Last price today | 25.44 |
| daily change today | 0.07 |
| today’s daily variation | 0.28 |
| today’s daily opening | 25.37 |
| Trends | |
|---|---|
| daily SMA20 | 24.01 |
| daily SMA50 | 22.45 |
| daily SMA100 | 22.93 |
| daily SMA200 | 21.26 |
| levels | |
|---|---|
| previous daily high | 26.09 |
| previous daily low | 25.16 |
| Previous Weekly High | 26.09 |
| previous weekly low | 24.72 |
| Previous Monthly High | 24.16 |
| Previous monthly minimum | 19.9 |
| Fibonacci daily 38.2 | 25.51 |
| Fibonacci 61.8% daily | 25.73 |
| Daily Pivot Point S1 | 24.99 |
| Daily Pivot Point S2 | 24.61 |
| Daily Pivot Point S3 | 24.06 |
| Daily Pivot Point R1 | 25.92 |
| Daily Pivot Point R2 | 26.47 |
| Daily Pivot Point R3 | 26.85 |
Source: Fx Street
I am Joshua Winder, a senior-level journalist and editor at World Stock Market. I specialize in covering news related to the stock market and economic trends. With more than 8 years of experience in this field, I have become an expert in financial reporting.


