
- Silver price gains some positive traction, although it is struggling to capitalize on the move above $23.00.
- The mixed technical setup justifies bulls’ caution before positioning for additional gains.
- A sustained break below the $22.50-$22.45 zone will be considered a new trigger for the bears.
The price of Silver (XAG/USD) builds on the previous day’s good bounce from near the $22.50 level, a multi-day low, and gains some traction on Thursday. The white metal maintains its bullish tone during the early stages of the European session and is currently trading around the $23.00 level, up 0.20% on the day.
The US Dollar (USD) selling trend following the FOMC continues, which in turn is seen as a key factor driving monetary flows into USD-denominated commodities, including XAG/USD. This, along with positive technical indicators on the daily chart, supports the prospects for a further appreciation move. That said, the recent repeated failures near the $23.60-$23.70 supply zone, which constitute the formation of a bearish multiple high pattern, justify the bulls’ caution.
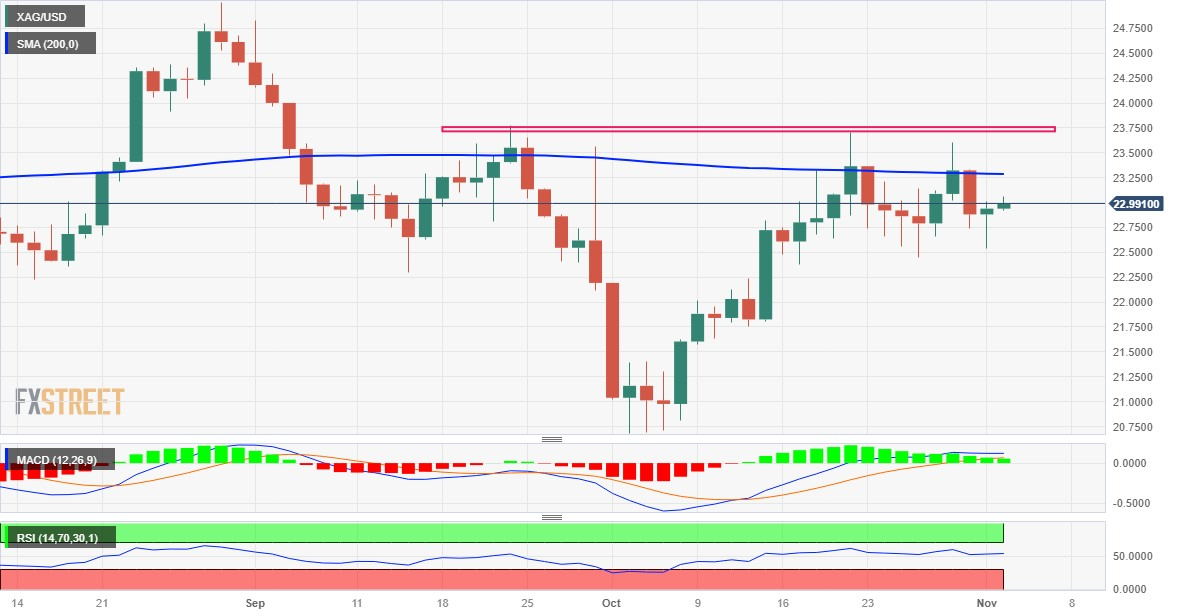
Meanwhile, any subsequent bullish move is likely to face strong resistance near the important 200-day SMA, currently around the $23.30 area. The bulls, for their part, must wait for a convincing break of the $23.60-$23.70 barrier before opening new positions. XAG/USD could then try to break above the $24.00 level and test the $24.20 barrier before making a new attempt to conquer the psychological level of $25.00.
On the other hand, the $22.50-$22.45 zone seems to have become strong immediate support. However, continued selling could trigger new bearish momentum and drag XAG/USD towards the $22.00 level. The bearish trajectory could further extend towards the $21.70 horizontal support on the way to the $21.35-$21.30 area and the $21.00 level. Over time, the price of Silver could fall to the $20.70-$20.65 area, down to the seven-month low reached in October.
Daily Silver Price Chart
Silver additional technical levels
Source: Fx Street
I am Joshua Winder, a senior-level journalist and editor at World Stock Market. I specialize in covering news related to the stock market and economic trends. With more than 8 years of experience in this field, I have become an expert in financial reporting.


