
- The price of Silver rebounds from lows of more than two weeks, although the rise seems limited.
- The technical situation favors the emergence of new sellers.
- A move above a descending trend line is needed to negate the downtrend.
The price of Silver (XAG/USD) recovers from the $22.20-$22.15 area, that is, from the two-week low reached this Thursday, and continues its intraday rise during the first half of the European session. The white metal reached a new daily high around the $22.40 area in the last hour, although the technical setup seems to be leaning in favor of the bears and warrants caution before positioning for any new appreciation move.
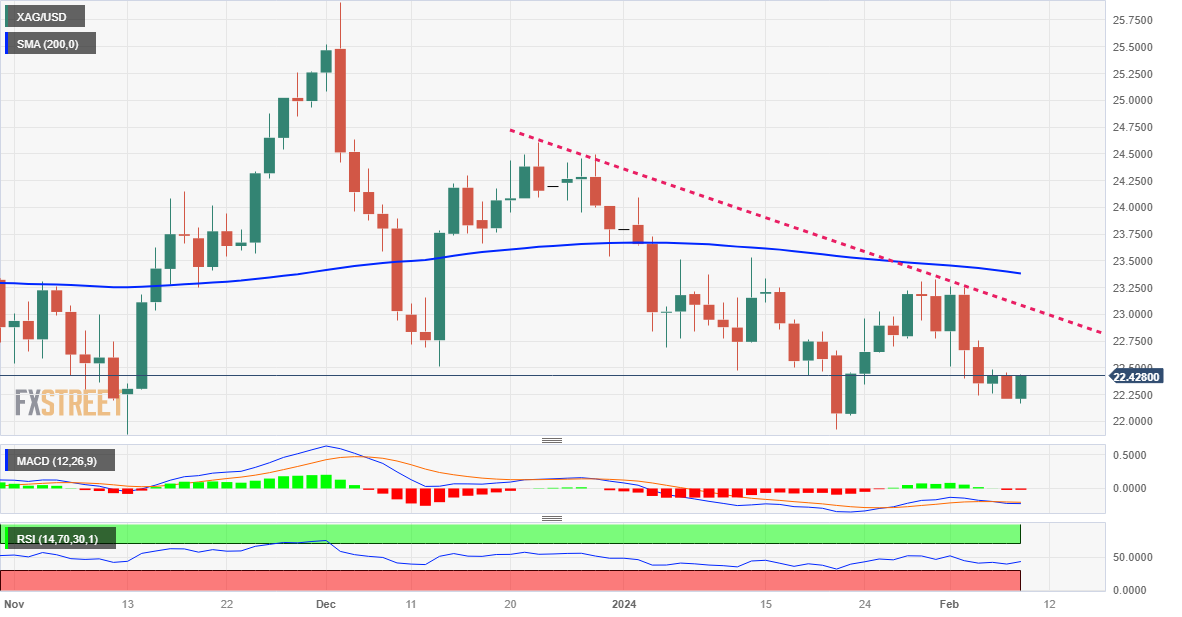
Recent repeated failures near the $23.30 resistance zone, which coincides with a descending trendline obstacle extending from the late December high, and a subsequent break through a short-term trading range validate the negative perspectives. Furthermore, the oscillators on the daily chart have just started to gain negative traction and are still far from being in oversold territory. This, in turn, suggests that the path of least resistance for XAG/USD is to the downside and any move higher could still be seen as a selling opportunity.
From current levels, the $22.80 to $22.85 area is likely to act as an immediate hurdle ahead of the $23.00 level, which is now approaching the downtrend line resistance. It is closely followed by the 200-day SMA near the $23.25 to $23.30 area, which if breached decisively could trigger a short-covering move and set the stage for additional gains. XAG/USD could then try to reclaim the round $24.00 level before rising to the $24.50-$24.60 resistance zone and try to reclaim the $25.00 psychological level.
On the other hand, weakness below the $22.20-$22.15 area could drag XAG/USD below $22.00, or to a two-month low hit in January. Some continuation selling could expose the next relevant support near the $21.40-$21.35 region before the white metal weakens further below the $21.00 level, towards the October low near the $20.70-$20.65.
Daily Silver Price Chart
Silver technical levels to watch
Source: Fx Street
I am Joshua Winder, a senior-level journalist and editor at World Stock Market. I specialize in covering news related to the stock market and economic trends. With more than 8 years of experience in this field, I have become an expert in financial reporting.


