
- The price of Silver meets certain sell-offs and returns part of the previous day’s gains to a three-week high.
- The extremely overbought RSI on the hourly charts has traders easing some of their bullish positions.
- Any further decline could be seen as a buying opportunity and is likely to remain limited.
Silver (XAG/USD) came under some selling pressure on Thursday and appears to have broken a five-day winning streak for now to hit a three-week high around the $24.35 played the day before. The white metal continues its intraday decline during the early hours of the European session and falls to a new daily low, around the $24.15 zone in the last hour.
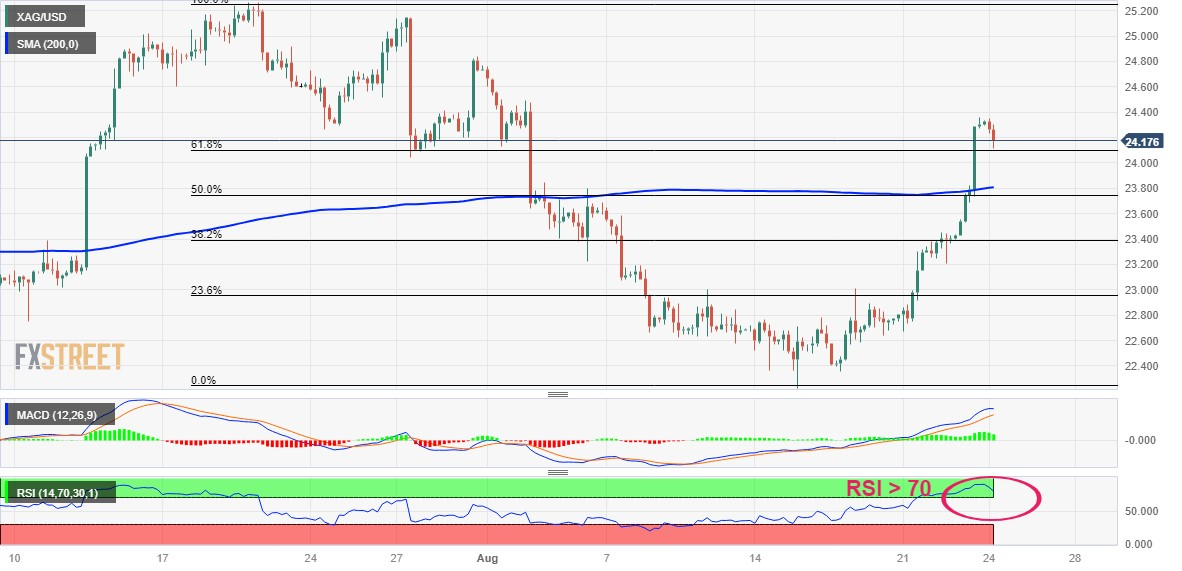
From a technical point of view, the extremely overbought Relative Strength Index (RSI) on the hourly charts turns out to be a key factor driving XAG/USD lower. That being said, the oscillators on the daily chart have just started to gain positive traction. Furthermore, the previous day’s break of the $23.75 confluence, which comprises the 200 SMA on the 4-hour chart and the 50% Fibonacci retracement of the July-August dip, favors the bulls.
Therefore, any subsequent dip below the $24.00 level will attract new buyers near the aforementioned confluence breakout point, which has now turned into support. This should help cap the fall in XAG/USD near the $23.40 zone. There is another support near the $23.25 area, which if broken could drag the white metal back towards the $23.00 level. A convincing break below this last level would nullify the positive outlook and shift the short-term bias in favor of the bears.
On the other hand, the bulls could wait for further buying above the previous day’s high around the $24.35 area before opening new positions. XAG/USD could then try to break through the $24.55-$24.60 intermediate barrier and continue to rally towards the psychological $25.00 level on its way to the July high around $25.25. Some continuation buying will signal a further breakout and pave the way for a further short-term appreciation move towards the round $26.00 level.
Silver price 4 hour chart
Silver additional technical levels
Source: Fx Street
I am Joshua Winder, a senior-level journalist and editor at World Stock Market. I specialize in covering news related to the stock market and economic trends. With more than 8 years of experience in this field, I have become an expert in financial reporting.


