
- Silver extends the previous day’s retracement from the $19.00 area.
- The technical setup favors the bears and supports the prospect of further losses.
- A sustained move above the $19.00 level is needed to nullify the negative bias.
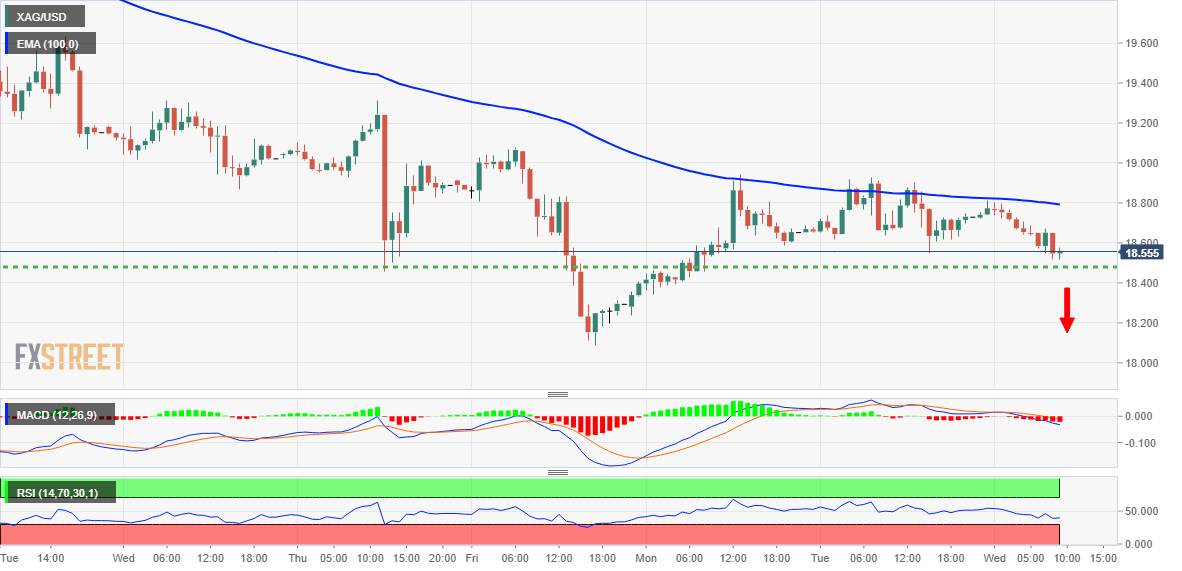
On Wednesday, silver comes under renewed selling pressure and extends the previous day’s modest pullback from around the $19.00 level. The white metal remains on the defensive during the first half of the European session and is currently flirting with daily lows around $18.50.
From a technical point of view, the recent bounce from a nearly three-week low hit last Friday is facing a rejection near the 100 hourly EMA. Meanwhile, the oscillators on the daily chart remain in the bearish zone and have regained negative traction on the one hour chart. This, in turn, supports the prospects for an extension of the intraday bearish movement.
Therefore, a further decline towards fundamental support around the $18.00 level remains a distinct possibility. A continuation of selling will be seen as a new trigger for the bears and will drag XAG/USD back towards the lows around the $17.55 area. Further down, the price could drop to the next relevant support, near the $17.00 round level.
On the other hand, the 100-hour SMA around the $18.90-$19.00 zone could act as an immediate hurdle. A sustained move above this region could trigger a short-covering rally and lift XAG/USD towards the $19.70-$19.80 zone en route to the psychological $20.00 level. The latter should act as a key point for the bulls, which if broken should pave the way for further gains.
The subsequent move higher has the potential to lift XAG/USD past the intermediate resistance at $20.50, towards the recovery of $21.00, which coincides with the 200 day EMA.
Silver 1 hour chart
silver key levels
Source: Fx Street
With 6 years of experience, I bring to the table captivating and informative writing in the world news category. My expertise covers a range of industries, including tourism, technology, forex and stocks. From brief social media posts to in-depth articles, I am dedicated to creating compelling content for various platforms.


