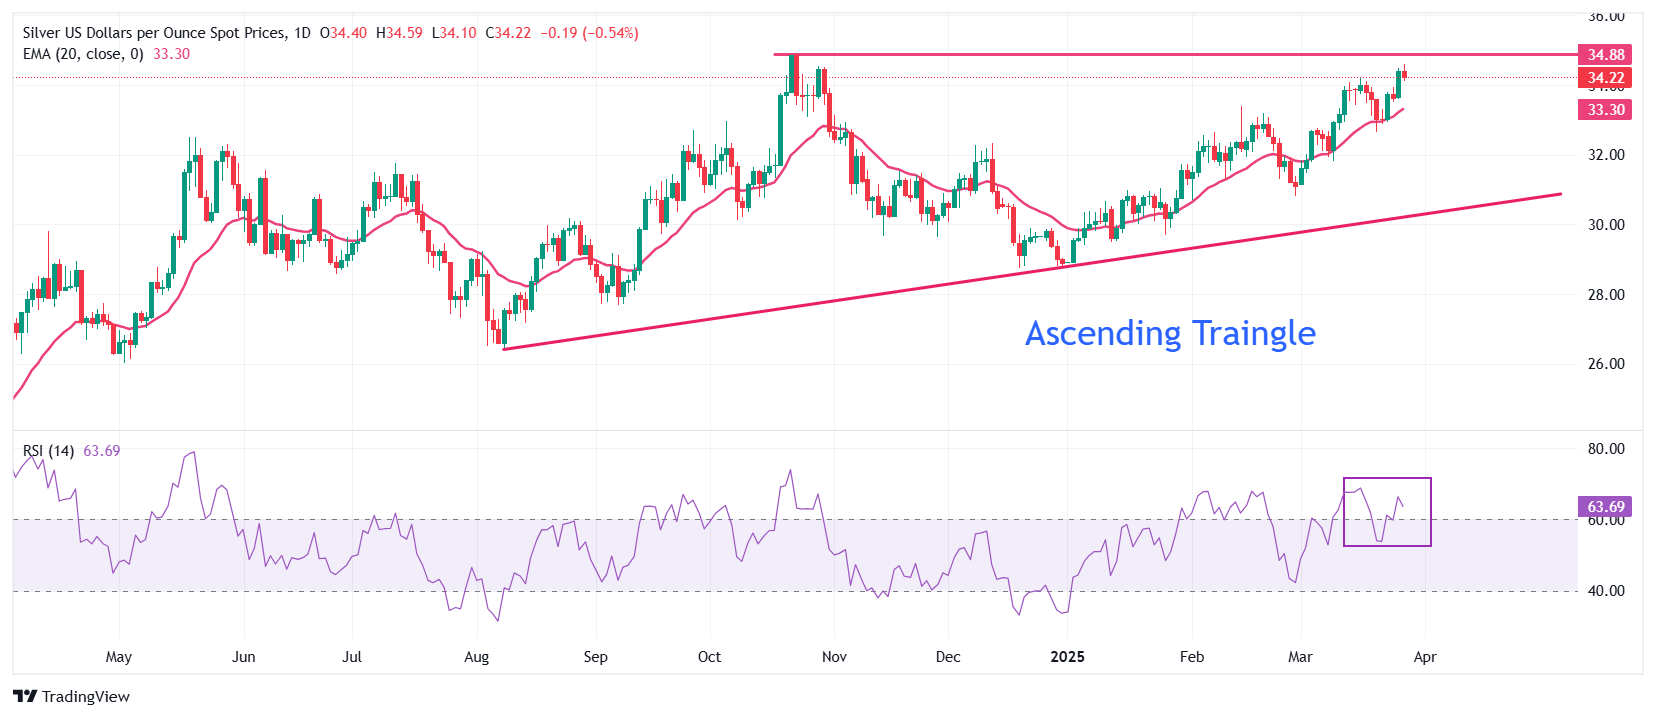
- The price of silver jumps up to about $ 34,60 as its demand as a safe shelter improves in increasing concerns about global trade.
- Investors expect Trump tariffs to impact economic growth and generate inflation worldwide.
- The U.S. underlying PCE inflation data increased at a faster rate than expected of 2.8% in February.
The price of silver (XAG) reaches a new maximum of five months about $ 34,60 at the negotiation hours of North America on Friday. White metal is strengthened as investors become cautious before April 2, when the president of the United States (USA) Donald Trump is scheduled to reveal reciprocal tariffs.
Market participants expect Trump tariffs to result in an economic deceleration and increase short -term inflationary pressures. Such scenario increases the attractiveness of shelter assets, such as silver.
However, the US dollar (USD) collapses since Trump’s tariffs will also weigh on the economic perspectives of the United States. Investors expect the impact that tariffs will have on US imports, which would be forced to transfer those costs to consumers. The US dollar index (DXY), which tracks the value of the dollar against six main currencies, falls to about 104.00.
Meanwhile, the underlying inflation of the US PCE higher than expected – which excludes volatile food and energy elements – fails to provide support to the US dollar. The underlying inflation data grew at a faster rate of 2.8% year -on -year compared to estimates and the previous publication of 2.7%. The underlying inflation of the PCE month to month grew 0.4%, faster than the expectations and previous reading of 0.3%.
The increasing inflation pressures force the Federal Reserve (FED) to maintain a restrictive monetary policy position for a longer period. The highest interest rates by the Fed are unfavorable for assets without performance, such as silver.
Technical Analysis of La Plata
The price of silver advances towards the flat edge of the formation of the graphic pattern of ascending triangle in the daily framework near the maximum of October 22, 34.87 $. The ascending edge of the aforementioned graphic pattern is placed from the minimum of August 8, 26.45 $. Technically, the ascending triangle pattern indicates indecision among market participants.
The 20 -day exponential (EMA) mobile average about $ 33.30 continues to support the price of silver.
The 14 -day relative force (RSI) index bounces above 60.00, suggesting a resurgence in the bullish impulse.
Looking down, the maximum of March 6, 32.77 will act as a key support for the price of silver. Meanwhile, the maximum of October 22, $ 34,87 will be the main barrier.
GRAPH DIARY OF LA PLATA
FAQS SILVER
Silver is a highly negotiated precious metal among investors. Historically, it has been used as a value shelter and an exchange means. Although it is less popular than gold, operators can resort to silver to diversify their investment portfolio, for their intrinsic value or as a possible coverage during periods of high inflation. Investors can buy physical silver, in coins or bullion, or negotiate it through vehicles such as the funds quoted in the stock market, which follow their price in international markets.
Silver prices can move due to a wide range of factors. Geopolitical instability or fears of a deep recession can cause the price of silver to shoot due to its safe refuge status, although to a lesser extent than that of gold. As an asset without performance, silver tends to climb with lower interest rates. Its movements also depend on how the US dollar (USD) behaves, since the asset is quoted in dollars (XAG/USD). A strong dollar tends to maintain the price of silver at bay, while a weaker dollar probably drives rising prices. Other factors such as investment demand, mining – silver supply is much more abundant than gold – and recycling rates can also affect prices.
Silver is widely used in the industry, particularly in sectors such as electronics or solar energy, since it has one of the highest electrical conductivities of all metals, surpassing copper and gold. An increase in demand can increase prices, while a decrease tends to reduce them. The dynamics in US economies, China and India can also contribute to price fluctuations: for the US and particularly China, its large industrial sectors use silver in several processes; In India, the demand for consumers for precious metal for jewelry also plays a key role in pricing.
Silver prices tend to follow gold movements. When gold prices go up, silver typically follows the same path, since their status as shelter is similar. The gold/silver ratio, which shows the number of ounces of silver necessary to match the value of an ounce of gold, can help determine the relative valuation between both metals. Some investors may consider a high ratio as an indicator that silver is undervalued, or that gold is overvalued. On the contrary, a low ratio could suggest that gold is undervalued in relation to silver.
Source: Fx Street
I am Joshua Winder, a senior-level journalist and editor at World Stock Market. I specialize in covering news related to the stock market and economic trends. With more than 8 years of experience in this field, I have become an expert in financial reporting.


