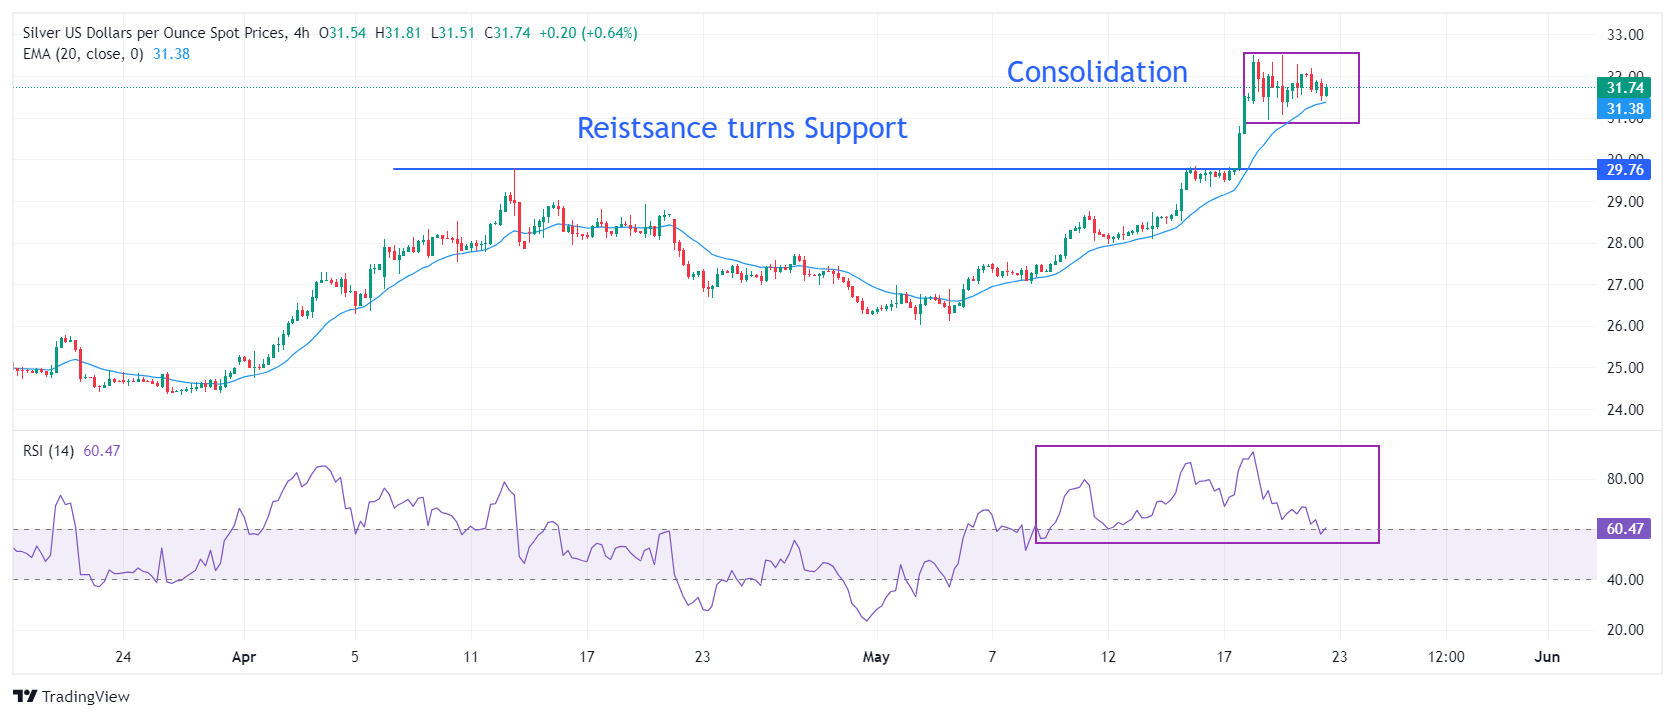
- The price of Silver plummets to $31.50 in a climate of caution ahead of the Fed's May minutes.
- Fed policymakers support higher interest rates for longer.
- The price of Silver consolidates near multi-year highs around $32.50
The price of Silver (XAG/USD) records a vertical drop to approach the crucial support of $31.50 in the early US session on Wednesday. The white metal weakens as the US Dollar and the yield Bond prices recover amid caution ahead of the release of the Federal Open Market Committee (FOMC) minutes of the May monetary policy meeting, which will be released later in the day. The FOMC minutes will provide a detailed explanation of policymakers' views on the outlook for interest rates.
Market sentiment is slightly cautious as Federal Reserve (Fed) policymakers continue to support interest rates remaining at their current levels until inflation sustainably returns to the desired rate of 2%. S&P 500 futures posted losses in the European session, showing a decline in investors' risk appetite.
The US Dollar Index (DXY), which tracks the greenback, jumps to 104.90. US 10-year Treasury yield rises to 4.46% as hawkish interest rate guidance from Fed officials has increased uncertainty over lower interest rates by part of the Fed from the September meeting. On Tuesday, Cleveland Fed President Loretta Mester said she wants to see inflation ease for a few more months to be safe before considering rate cuts.
Higher yields on interest rate assets increase the opportunity cost of investing in non-yielding assets, like Silver.
Silver technical analysis
Silver price turns sideways after printing a new multi-year high near $32.50. The white metal saw a strong bullish move after breaking above the horizontal resistance drawn from the April 12 high at $29.80. The upward slope of the 20-period EMA near $31.40 suggests that the uptrend is intact.
The 14-period RSI is moving comfortably in the bullish range of 60.00-80.00, indicating that momentum remains tilted to the upside.
Silver Four Hour Chart
XAG/USD
| Overview | |
|---|---|
| Latest price today | 31.76 |
| Today Daily variation | -0.22 |
| Today's daily variation | -0.69 |
| Today's daily opening | 31.98 |
| Trends | |
|---|---|
| daily SMA20 | 28.25 |
| 50 daily SMA | 27.15 |
| SMA100 daily | 25.06 |
| SMA200 Journal | 24.17 |
| Levels | |
|---|---|
| Previous daily high | 32.5 |
| Previous daily low | 31.07 |
| Previous weekly high | 31.6 |
| Previous weekly low | 27.97 |
| Previous Monthly High | 29.8 |
| Previous monthly low | 24.75 |
| Daily Fibonacci 38.2 | 31.96 |
| Fibonacci 61.8% daily | 31.62 |
| Daily Pivot Point S1 | 31.2 |
| Daily Pivot Point S2 | 30.42 |
| Daily Pivot Point S3 | 29.77 |
| Daily Pivot Point R1 | 32.63 |
| Daily Pivot Point R2 | 33.28 |
| Daily Pivot Point R3 | 34.06 |
Source: Fx Street
I am Joshua Winder, a senior-level journalist and editor at World Stock Market. I specialize in covering news related to the stock market and economic trends. With more than 8 years of experience in this field, I have become an expert in financial reporting.


