
- Silver loses 1.82% on rising US Treasury yields and increasing odds that the Fed will hike rates in July.
- A drop in Silver below the 200 day EMA could trigger further losses unless the swing low of $22.53 offers some respite.
- A potential bounce could lead silver to test $23.00 and if broken, recapture the 20-day EMA at $23.06.
The price of the Silver fell below $23.00 as the US Treasury yield soared following the latest Fed Minutes and a series of US economic data raised the odds that the Fed would raise rates. types in July. At the time of writing, the XAG/USD pair is trading at $22.69, down 1.82% on the day.
XAG/USD Price Analysis: Technical Perspective
The XAG/USD pair turned bearish during the session on Thursday. The fall in the price of silver below the 200 day EMA at $22.93 opened the door for further losses, although it has so far failed to break above the May 26 swing low of $22.53.
If the XAG/USD pair sustains above the latter value, the white metal could consolidate around the $22.50-$22.90 range. Otherwise, silver would slide below the bottom of the range and expose the June 22 swing low at $22.11 before testing $22.00. Once broken, the next support for XAG/USD will be the March 16 swing low at $21.47.
Conversely, if the XAG/USD rally and recapture the 200 day EMA, the next resistance for the XAG/USD will be the psychological $23.00 level. A break of the latter will increase the odds of a rally to the 20-day EMA at $23.06.
XAG/USD Price Action – Daily Chart
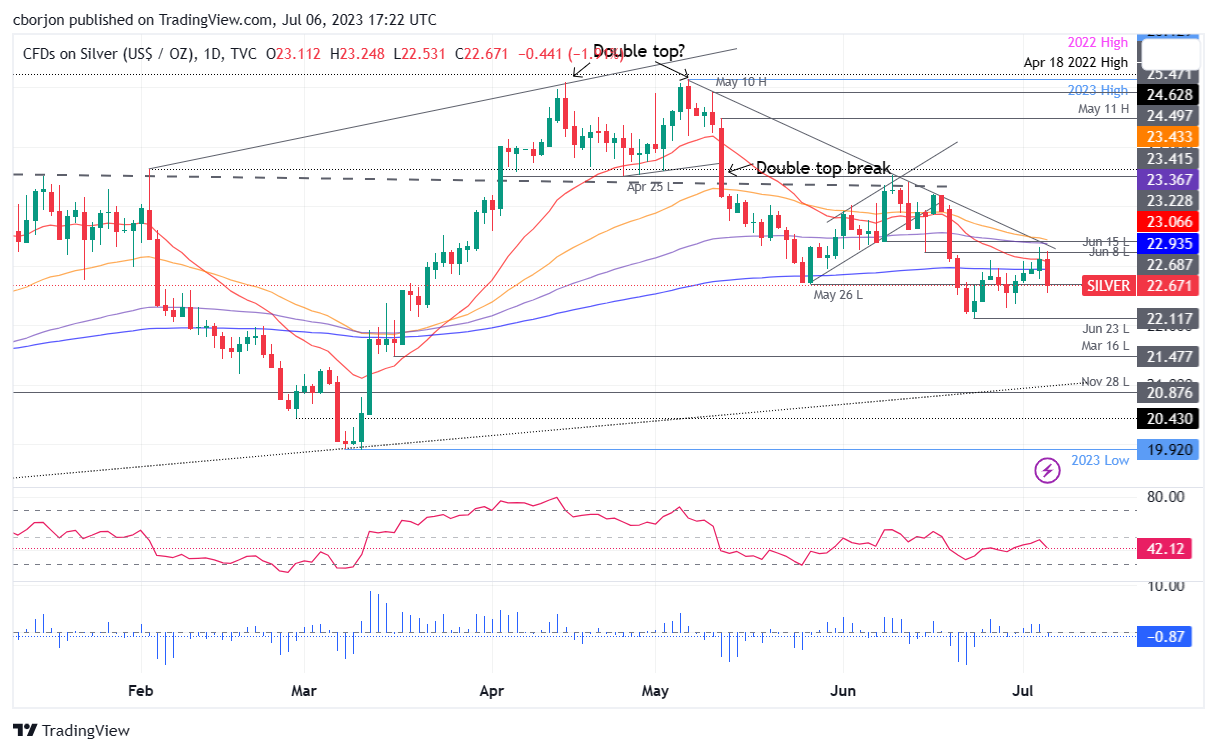
Source: Fx Street
I am Joshua Winder, a senior-level journalist and editor at World Stock Market. I specialize in covering news related to the stock market and economic trends. With more than 8 years of experience in this field, I have become an expert in financial reporting.


