
- Silver fails to hold its previous gains above the 20-day EMA, and traders are targeting $23.00.
- Silver Price Analysis: Consolidated, slightly biased to the downside as oscillators turned bearish.
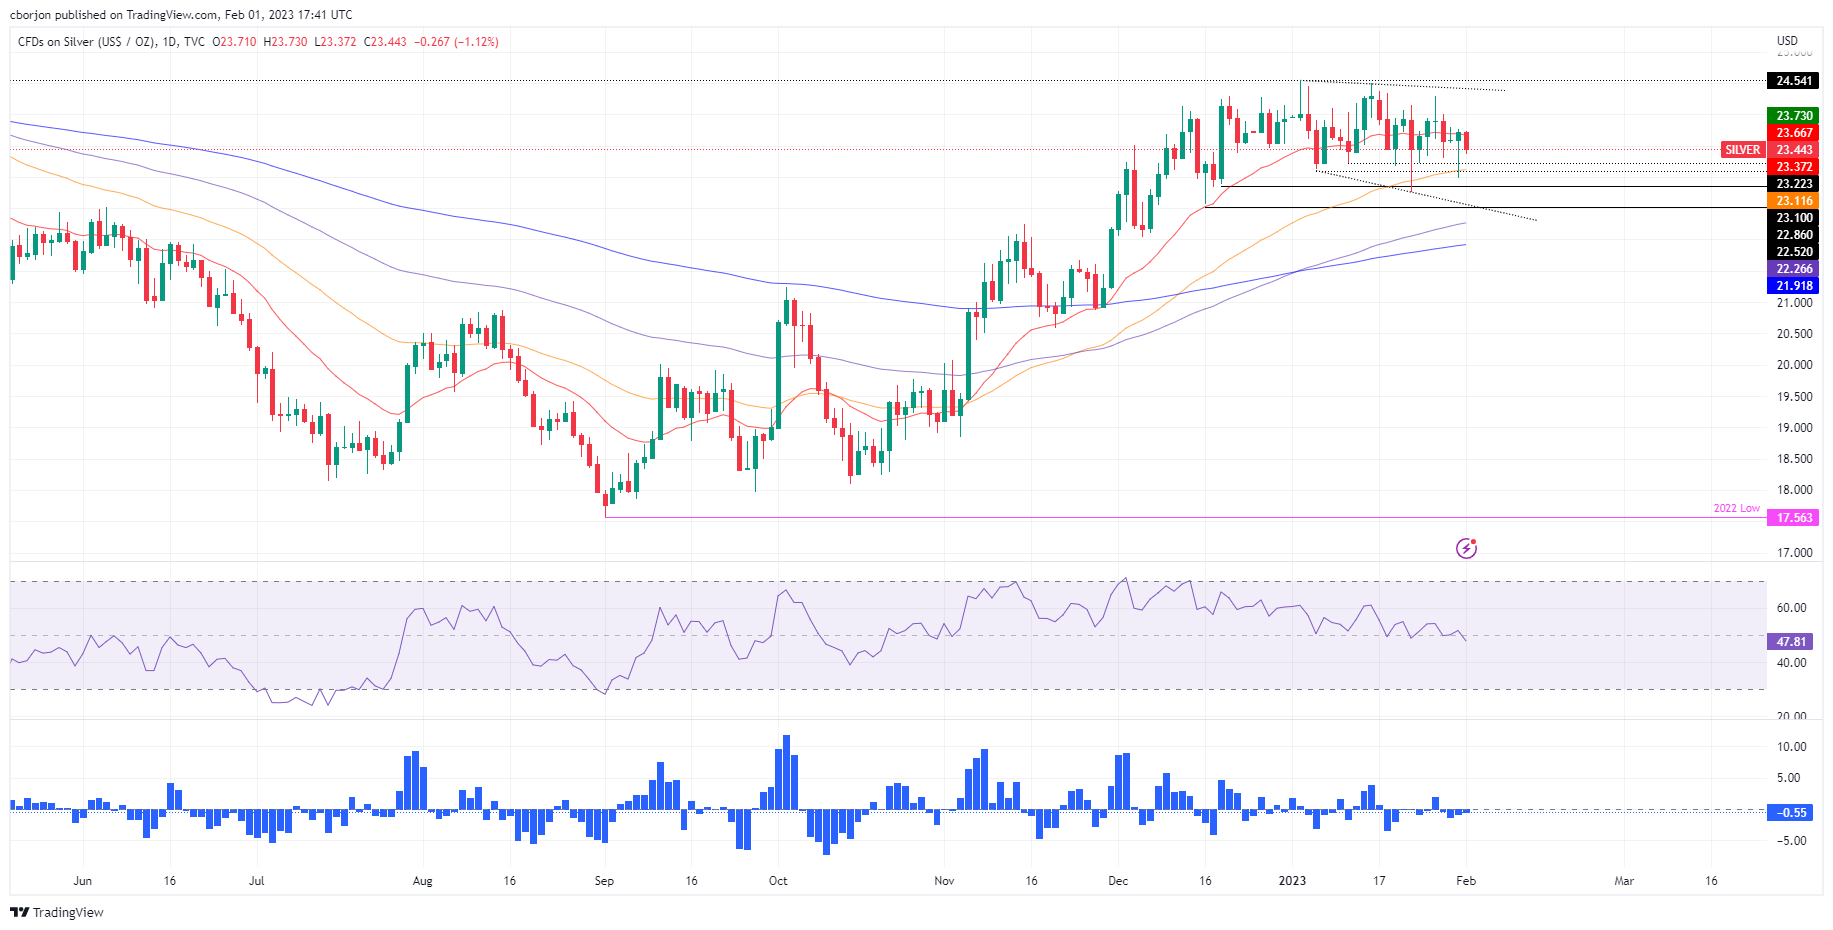
The price of the Silver is fighting the 20-day EMA at $23.66 and is falling towards daily lows around $23.45 as investors prepare for the US Federal Reserve’s monetary policy decision. USA (Fed). Therefore, XAG/USD traders are squaring off their positions, waiting for Jerome Powell and his colleagues. As of this writing, XAG/USD is trading at $23.44, down 1.12% from its opening price.
Silver Price Analysis: XAG/USD Technical Outlook
Silver remains under pressure ahead of the FOMC decision, trapped within Tuesday’s price action, which saw a test of the 50-day EMA at $23.11, though it was quickly rejected, hitting a daily close above the 20-day EMA. However, Wednesday’s story is different. XAG/USD dipped below Monday’s low of $23.54, aiming to extend its losses towards the $23.00 figure.
Momentum indicators such as the Relative Strength Index (RSI) turned bearish, while the Rate of Change (RoC) suggests that sellers are gathering momentum.
Given the background, the first support for XAG/USD would be the psychological level of $23.00. A break of the latter and the yearly low at $22.76 is on the cards.
As an alternative scenario, a recovery of the 20 day EMA by XAG/USD would expose $24.00. After breaking above the 20-day EMA, silver would test the $24.54 high, followed by a rally towards $25.00.
Silver Key Technical Levels
Source: Fx Street
I am Joshua Winder, a senior-level journalist and editor at World Stock Market. I specialize in covering news related to the stock market and economic trends. With more than 8 years of experience in this field, I have become an expert in financial reporting.


