
- The price of Silver falls more than 1.14% while operators focus their attention on the Dollar, although it continues to rise 1.90% for the week.
- The technical charts indicate a bearish trend with possible support at $30.00 after breaking below the 100-day SMA.
- The RSI trends suggest that bearish momentum is increasing, indicating possible further declines in silver prices.
The price of Silver fell more than 1.14% on Wednesday, although it continues to rise 1.90% in the week as operators abandon the gray metal in favor of the Dollar. At the time of writing, XAG/USD is trading at $30.82 per troy ounce, below the psychological level of $31.00.
XAG/USD Price Analysis: Technical Perspective
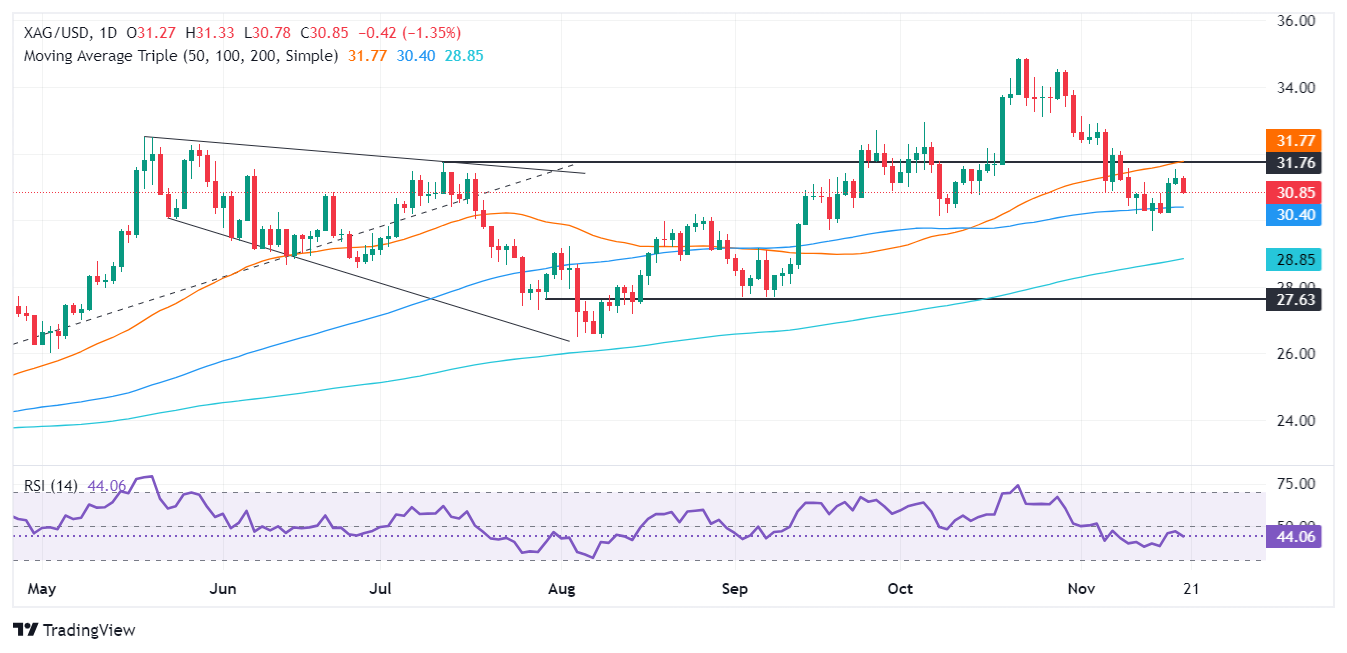
The non-yielding metal is trading within the range of $30.38-$31.75, protected by the 100-day and 50-day simple moving averages (SMA), respectively. Despite being range-bound, XAG/USD has a short-term bearish bias as the precious metal makes a successive series of lower highs and lower lows.
Once sellers push XAG/USD below the 100-day SMA, a bearish resumption will occur. If broken, the next support would be $30.00 a troy ounce, followed by the November 14 low of $29.68 and the 200-day SMA at $28.88.
If buyers were to step in and push XAG/USD above $31.00, next would be the 50-day SMA, before the $32.00 figure.
Indicators such as the Relative Strength Index (RSI) suggest that the bears continue to gain strength. Therefore, a further decline in XAG/USD is expected.
XAG/USD Price Chart – Daily
Source: Fx Street
I am Joshua Winder, a senior-level journalist and editor at World Stock Market. I specialize in covering news related to the stock market and economic trends. With more than 8 years of experience in this field, I have become an expert in financial reporting.


