
- The gray metal is trading defensively below $23.00.
- Recent highs near $23.50 limit the upside so far.
- There is tentative support at the 100-day SMA ($23.48).
silver prices start the new trading week on the back foot and pull back for the first time after three consecutive daily advances on Monday, all the while testing levels below $23.00.
Indeed, silver is back under selling pressure despite the dollar’s bearish behavior thus far and shortly after hitting fresh multi-week highs just above $23.50 on March 24.
Should bullish sentiments return to the market, the industrial metal is expected to find the next upside barrier at the March high of $23.52 (March 24). Breaking above this level should put silver on course for a possible visit to the 2023 high of $24.62 (Feb 2) before the April 2022 high of $26.21 (April 18). If the losses accelerate, then there is tentative support at the 100-day and 55-day SMAs at $22.48 and $22.35, respectively, ahead of minor support at $21.47 (March 16 low). Further down is the key 200-day SMA at $20.96, which precedes the 2023 low at $19.90 (March 10).
XAG/USD daily chart
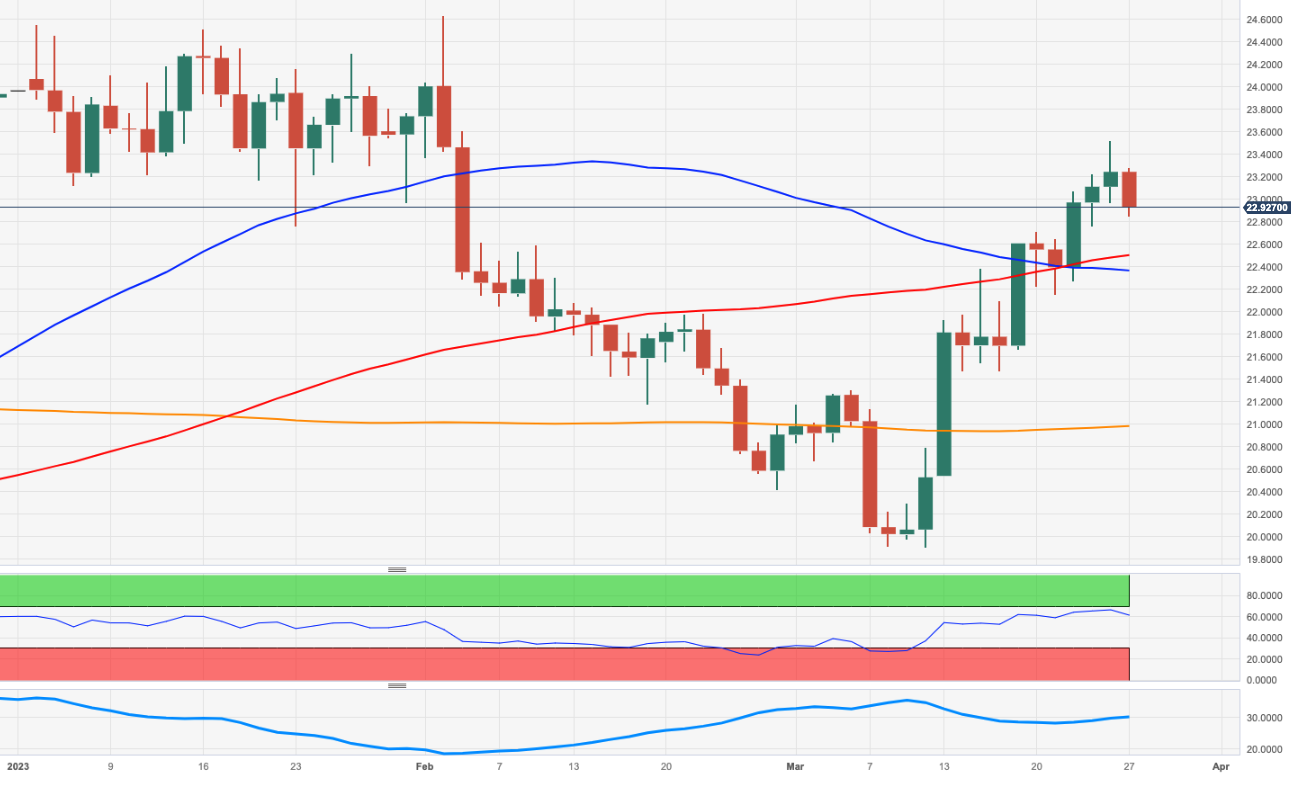
Source: Fx Street
I am Joshua Winder, a senior-level journalist and editor at World Stock Market. I specialize in covering news related to the stock market and economic trends. With more than 8 years of experience in this field, I have become an expert in financial reporting.


