
- Silver rises more than 1.50%, benefiting from the Fed’s dovish stance, and US bond yields fall.
- As investors priced a pause in the Fed’s tightening cycle, the 10-year bond yield and the US dollar fell.
- Technical outlooks show a sideways trend as XAG/USD struggles to stay below the 20 and 50 day EMAs; Support zones and potential resistance levels are highlighted.
The price of silver rose steadily more than 1.50% on Thursday, encouraged by several reasons. First, dovish comments from Federal Reserve (Fed) officials sent US bond yields falling over the past 48 hours. The easing of the US debt ceiling saga, moving towards the US Senate, and weakening manufacturing activity, were the final nails in the coffin for the dollar. Therefore, XAG/USD is trading at $23.85 after falling to $23.28.
The 10-year US Treasury yield falls four basis points (bps), from around 3.64% to 3.60%, a tailwind for the non-yielding metal. Consequently, the US Dollar Index (DXY) plunged more than 0.50% to 103.573 as investors began to price in the Fed’s first pause after the 500 basis point hike.
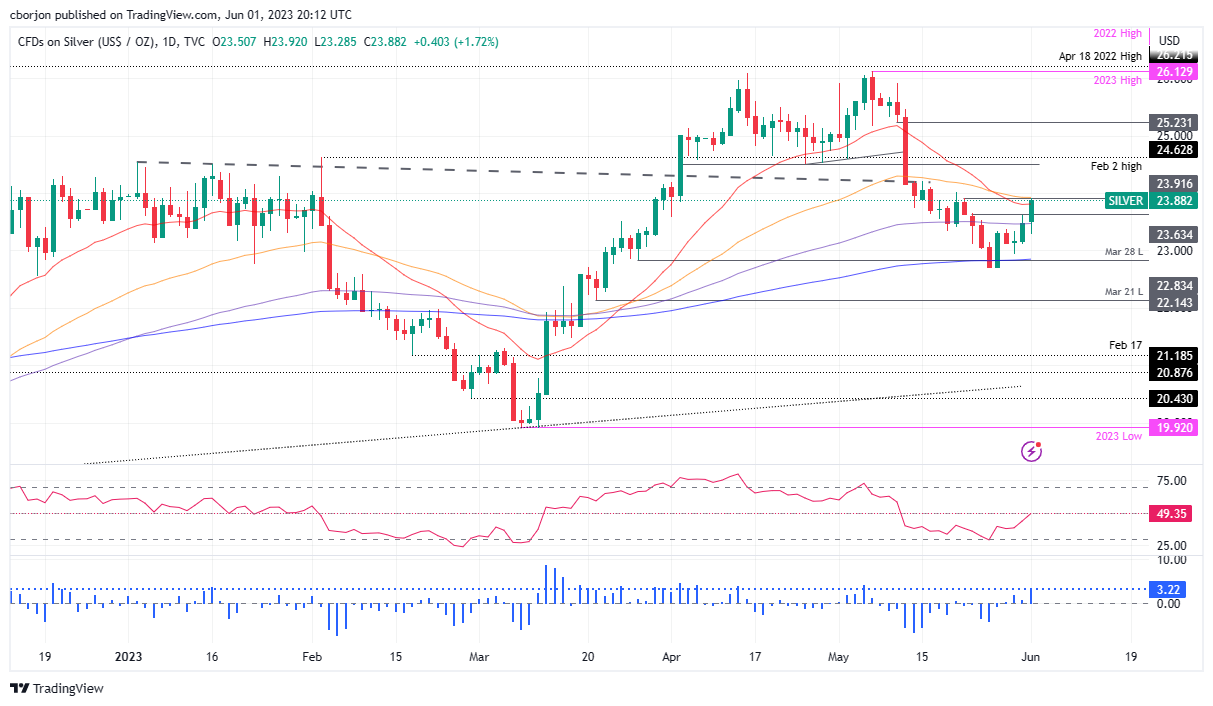
XAG/USD Price Analysis: Technical Perspective
The XAG/USD pair remains sideways after an ongoing correction lifted silver from lows around $22.68. Although the 200 day EMA price level cushioned the fall in Silver, downside risks remain as XAG/USD struggles to stay below the 20 and 50 day EMAs. at $23.80 and $23.93, respectively.
In that case, the next support zone would be the 100 day EMA at $23.47. A break of the latter and XAG/USD could drop below $23.00 to retest the 200 day EMA at $22.85, briefly tested on May 25-26.
Conversely, the first resistance for XAG/USD would be the 50-day EMA at $23.93. Once said resistance is broken, $24.00 is in play, followed by a crucial test of the swing low on April 25, which became resistance at $24.49.
XAG/USD Price Action – Daily Chart
Source: Fx Street
I am Joshua Winder, a senior-level journalist and editor at World Stock Market. I specialize in covering news related to the stock market and economic trends. With more than 8 years of experience in this field, I have become an expert in financial reporting.


”")

