
- The price of Silver rises and reaches the top of a long-term range before turning lower.
- It has formed a bearish candlestick pattern, which reinforces the reversal thesis.
- A retracement is expected to a group of MAs at $23,000, subject to continued weakness.
The price of Silver (XAG/USD) is trading at $24,750 on Friday, after touching the top of the multi-month range at around $25,700 and reversing lower.
On Thursday, Silver formed a bearish engulfing candlestick on the daily chart, reinforcing the reversal and suggesting further declines in the near term.
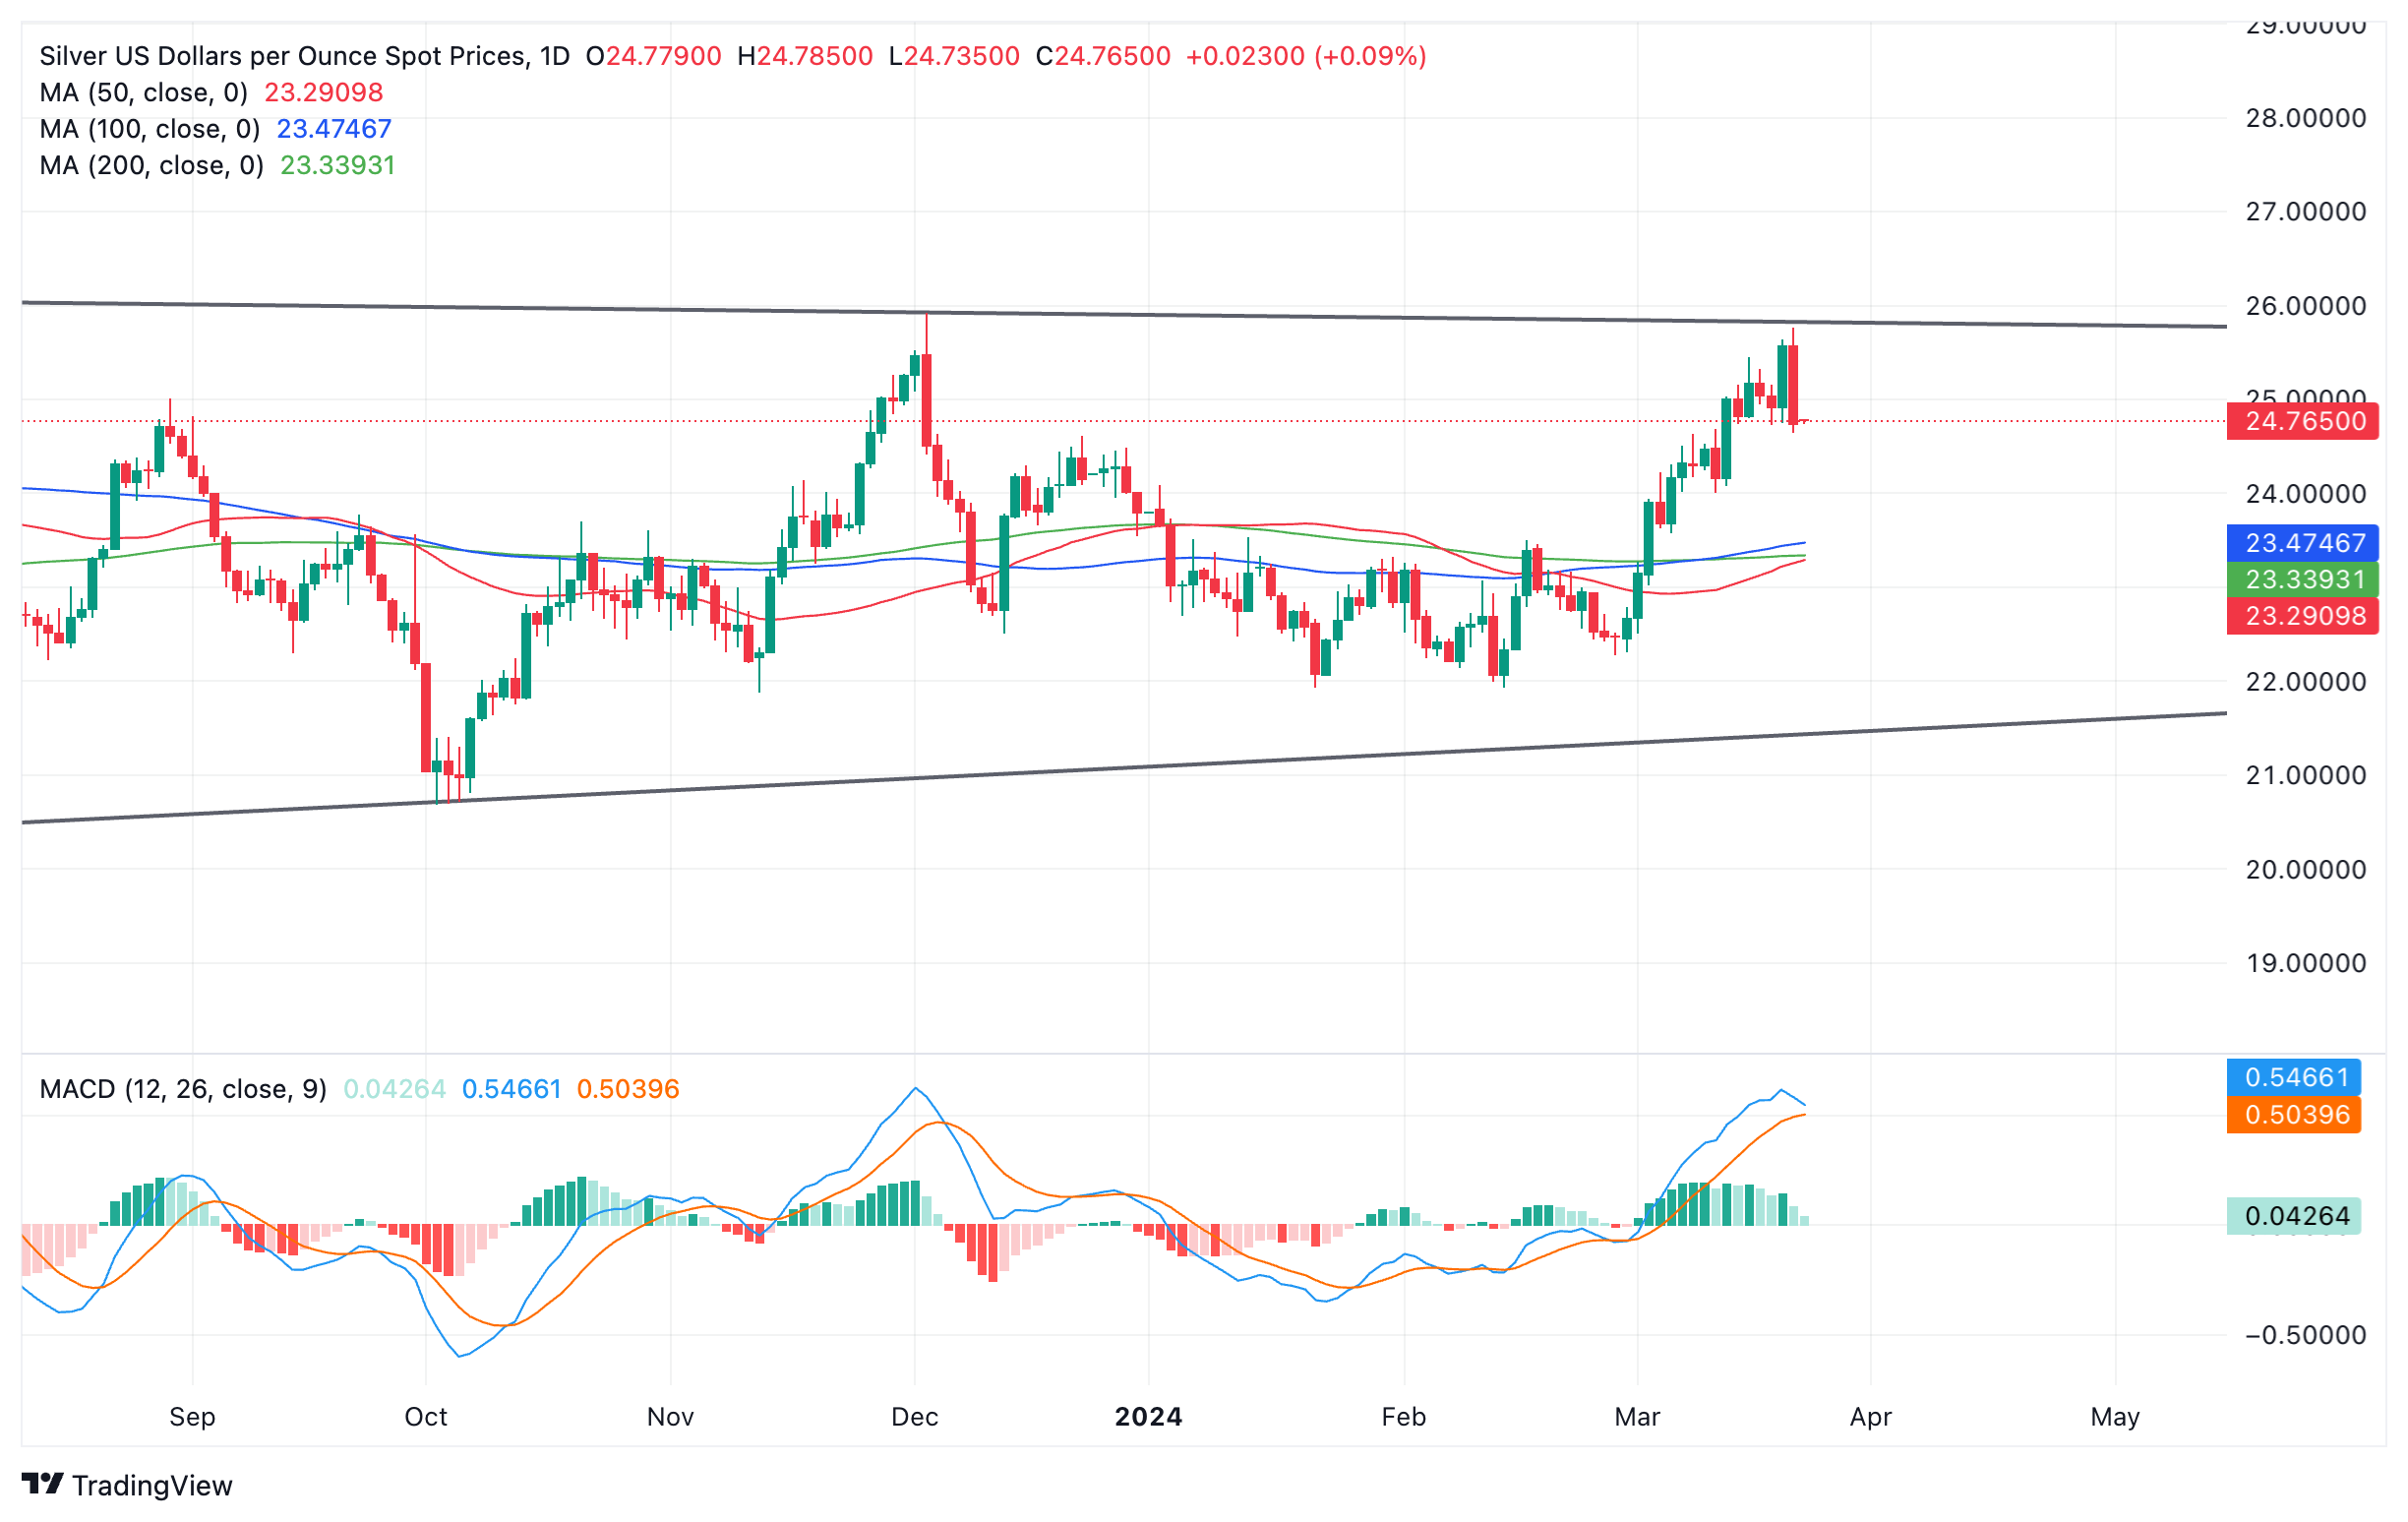
Silver vs. US Dollar: Daily Chart
The moving average convergence/divergence (MACD) momentum indicator threatens to cross below its signal line, adding credibility to the bearish reversal. The MACD is an especially reliable indicator in markets that are within a range, so a crossover would be a good sell signal.
If the pair breaks below $24,405, it is likely to continue south towards a potential target in the group of main moving averages, below $23,000, starting with the 100-day simple moving average (SMA) at $23,475 .
However, a break above Thursday's highs of $25,770 would indicate a likely extension of the uptrend.
A decisive break above the range highs would indicate even greater bullish momentum. Such a move would conservatively target the 0.618 extrapolation of the range height from the upside breakout point, and a target at $28,524.
Source: Fx Street
I am Joshua Winder, a senior-level journalist and editor at World Stock Market. I specialize in covering news related to the stock market and economic trends. With more than 8 years of experience in this field, I have become an expert in financial reporting.


